In modern distributed systems such as microservices, cloud, and hybrid infrastructure, understanding what’s happening “inside” your systems from the outside is a challenge. That’s where observability comes in—the ability to infer the internal state of a system based on the data it emits.
Observability refers to the ability to analyze and measure the internal states of systems based on their outputs and interactions across assets. It’s a key concept in any observability platform or observability tool, as it empowers IT teams to detect, diagnose, and resolve issues more quickly.
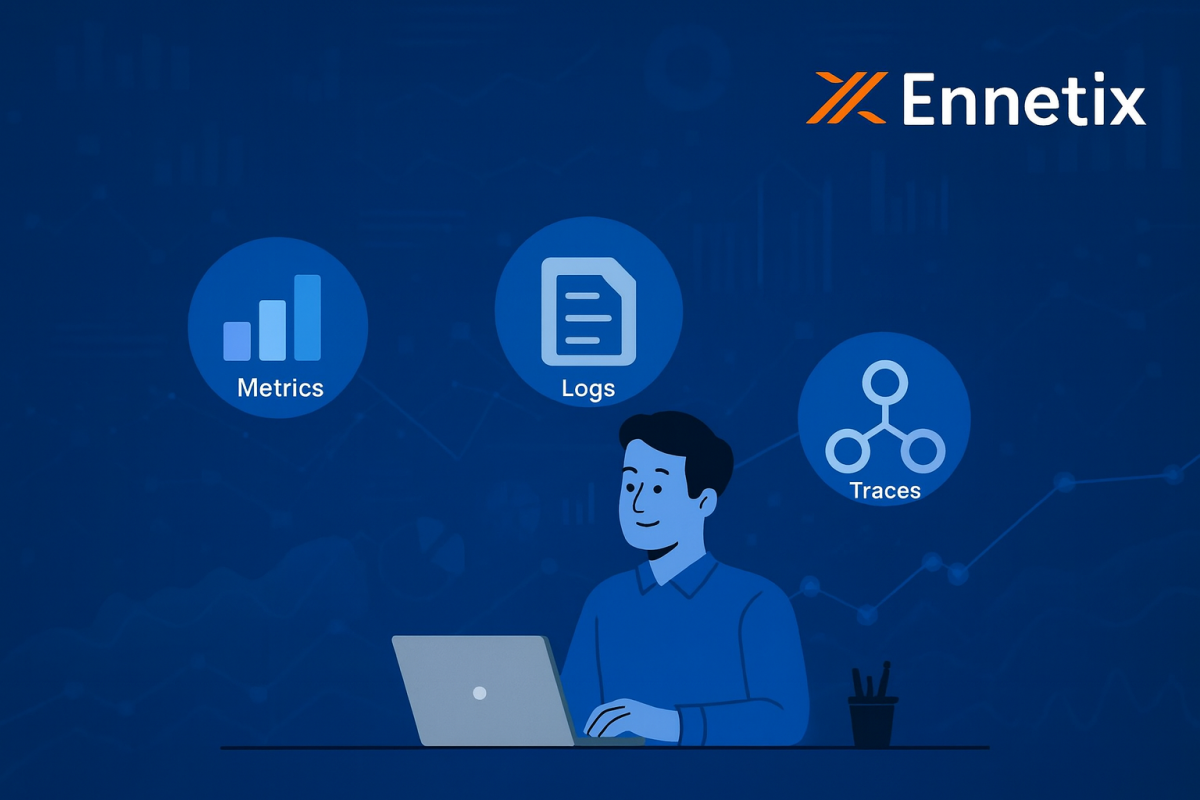
Observability is built on three pillars: metrics, logs, and traces. Individually, they offer different views, but together they provide a holistic, deep understanding of your system. Each pillar of observability contributes a unique dimension of insight and performance to a system
1. Metrics: Quantifying System Health
Definition & Purpose
Metrics are numerical measurements collected at regular intervals—often referred to as time-series telemetry data. Examples include CPU usage, request rate, error count, memory consumption, or latency percentiles. These metrics and traces provide a structured overview of how systems behave over time.
Alternatively, metrics can be defined as quantitative, aggregatable measurements tracked over time. They reflect how various parts of your system are performing—think CPU usage, memory consumption, request rate, error count, latency percentiles, and more.
Why Metrics Enable Observability
Metrics give you a high-level, real-time view of system health. They’re the first line of defense in any observability solution and form the foundation for alerting mechanisms.
Easy to graph, monitor, and set alerts.
Detect anomalies such as a sudden spike in error rate or a drop in throughput.
Ideal for trend analysis and capacity planning.
Provide a baseline snapshot of overall performance.
Enable trend detection, baseline comparison, and anomaly alerting.
They are efficient to store, visualize (via dashboards), and query (through time-series databases).
Limitations / Trade-Offs
Metrics are aggregated and may hide nuances (for example, tail latencies). They don’t always explain why something is happening.
Sampling and aggregation can lose detail.
Require strong instrumentation and labeling to be effective (e.g., dimensional labels).
Should be used alongside logs and traces within your observability pillars for full insight.
2. Logs: The Narrative Behind the Numbers
Definition & Purpose
Logs are timestamped records of events and state changes inside a system. They can be unstructured text, JSON, or a structured schema with metadata. Examples include event logs, error messages, transaction records, debug statements, or audit trails.
In the context of an observability platform, logs provide detailed insight into what happened, where, when, and how—giving engineers granular visibility across systems.
Why Logs Enable Observability
Provide fine-grained context and timelines.
Critical for diagnosing root causes, debugging, or performing forensics.
Contain contextual metadata that ties together disparate events.
Show exceptions, stack traces, user IDs, and system state variables.
Enable root cause analysis when metrics show deviations.
Logs are vital for implementing observability because they help correlate data across multiple sources when issues arise.
Limitations / Trade-Offs
Log volume can grow rapidly, creating storage and indexing challenges.
Searching massive log datasets is resource-intensive.
Unstructured logs are difficult to query effectively.
Overly verbose logging can impact system performance.
To overcome these, many organizations now use observability tools with automated log management and correlation capabilities that link logs with metrics and distributed traces.
3. Traces: Understanding System Journeys
Definition & Purpose
Traces, or more specifically distributed traces, follow the journey of a request or transaction as it travels through multiple services and components. Each segment (or “span”) records timing, metadata, and relationships—allowing engineers to reconstruct the full path and timing breakdown.
Traces are essential to any modern observability tool because they reveal how requests propagate across microservices and where latency issues occur.
Why Traces Enable Observability
Provide visibility into cross-service interactions and dependencies.
Identify performance bottlenecks and latency hotspots.
Pinpoint which component or service failed or slowed down.
Offer contextual insights beyond what metrics or logs can show.
Expose inter-service dependencies invisible in other telemetry sources.
Limitations / Trade-Offs
Require instrumentation to propagate trace context (e.g., trace headers).
Can add request overhead; hence, sampling is often used.
Tracing every transaction in complex architectures can become expensive.
Interpreting traces across large-scale microservices can be challenging.
Still, when used with metrics and logs, distributed traces offer unmatched clarity for diagnosing performance bottlenecks.
How the Three Observability Pillars Work Together
Each pillar of observability offers a different perspective—but their real power comes when used together.
Pillar
Strength
What It Lacks
How It Complements Others
Metrics
Fast, real-time trend detection
Lacks detailed context
Detect anomalies or trigger alerts
Logs
Deep context, full detail
Hard to scale, slow to search
Investigate root causes of metric anomalies
Traces
End-to-end transaction visibility
Requires instrumentation
Correlate with logs and metrics for complete insights
Beyond the Three Pillars: The Future of Observability
While the three pillars of observability—metrics, logs, and traces—remain foundational, the next evolution of observability is about deeper context and automation.
1. Context and Metadata
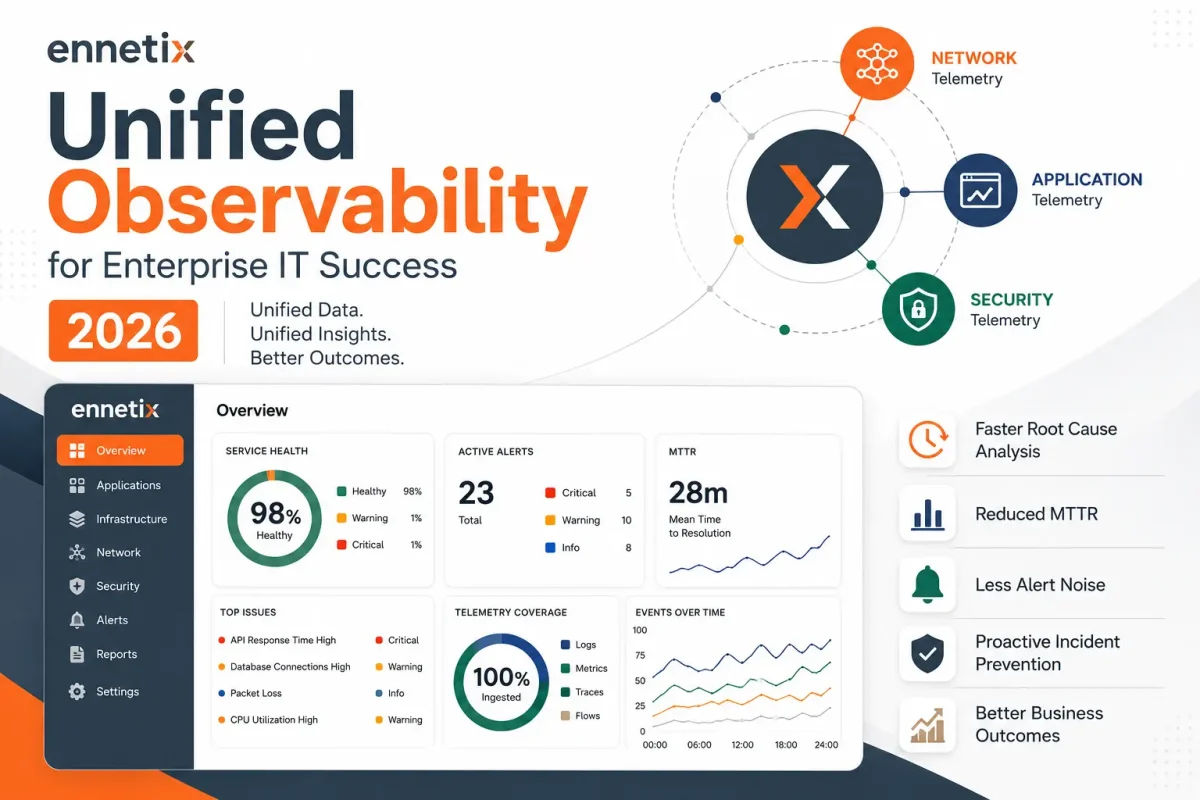
Without contextual data (environment, topology, service dependencies, user identities), raw telemetry can be meaningless. Advanced observability platforms now embed this context to improve signal correlation and actionability.
2. Correlation and Linking
Modern observability tools automatically correlate logs, metrics, and trace spans. For instance, linking a latency spike in metrics to a specific error trace in logs enhances investigation speed.
3. Alerts and Automation
Implementing observability is not just about visibility—it’s about automation. Modern systems can trigger proactive alerts or even automated remediation based on predefined patterns.
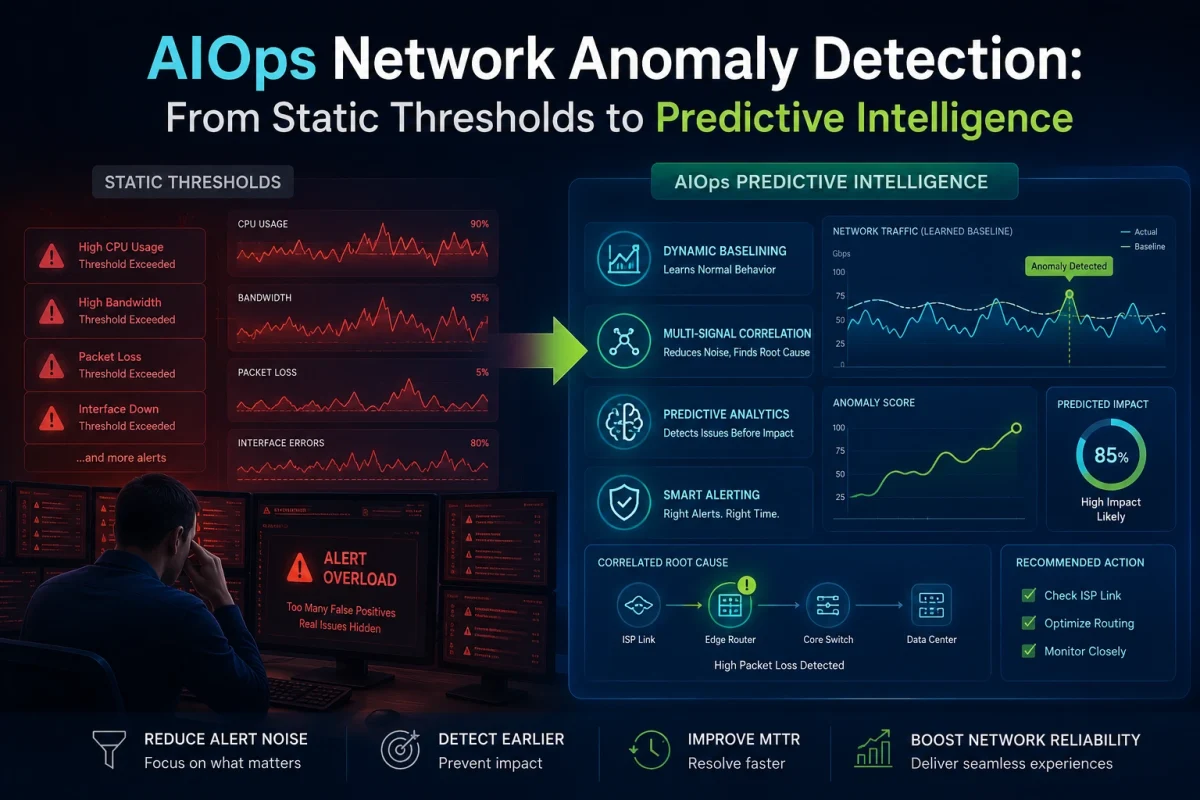
4. AI-Powered Analytics
AI and ML models are increasingly being used in observability solutions for anomaly detection, predictive analytics, and root cause prediction—reducing manual triage effort.
Conclusion
The three observability pillars—metrics, logs, and traces—form the backbone of any observability platform. However, observability today extends beyond these basics. To build a resilient digital environment, teams must correlate signals, add context, and implement intelligent automation using the right observability tools.
In an era of complex, distributed architectures, mastering metrics, event logs, and distributed traces is key to ensuring reliability, optimizing performance, and achieving complete system visibility.
Jim Olson served as a Business Specialist at the Engineering Translational Technology Center (ETTC) at University of California, Davis, advising on company formation, strategy,and financing. He also taught classes as an Adjunct Faculty in the Graduate School of Management at UC Davis for over a decade. Previously, he was Executive Vice President of video compression systems at TANDBERG Television and CEO of SkyStream. At TANDBERG, he focused on building and marketing video compression offerings. Jim has held leadership roles at 3Com Corporation and Hewlett-Packard, where he led several successful product launches. He is an active angel investor and a guest lecturer at Stanford University and UC Davis. Jim holds a BSEE from UC Davis, and MSEE and MBA degreesfrom Santa Clara University.
Sudip Nandy is an acclaimed business leader with over 30 years of experience in global strategy, enterprise building, and investments. He is currently a Senior Advisor and has previously served as Managing Director and Operating Partner at ChrysCapital, a leading investment firm. He was Executive Chairman of Infogain Corporation and Board Member at Liquid Hub Inc. Sudip is also a Director on the Board of GeBBS Healthcare. Earlier, he was CEO and Chairman (India) for Aricent. He is the former Chief Strategy Officer and Head of M&A at Wipro, where he led several successful mergers and acquisitions. Sudip holds a Bachelor’s Degree in Physics from the Indian Institute of Technology (IIT), Kharagpur, andanother in Electrical Technology and Electronics from the Indian Institute of Science (IISc),Bengaluru. He also has an MBA from the Indian Institute of Management (IIM), Ahmedabad.
Prem Jain was CEO and Co-Founder of Pensando Systems, a cloud and enterprise data center startup, which was founded in 2017 and acquired by AMD in 2023. Before Pensando, Prem spent 23 years at Cisco Systems, where he was known as the “heart, soul, and brains” behind several successful startups. As the Senior Vice President and General Manager of Insieme BU, he developed Software Defined Networking (SDN/ACI) products and next-generation data-center switches. Prem joined Cisco in 1993 after it acquired Crescendo Communications, where he was Vice President of Systems Architecture. He holds a B.E. from Birla Institute of Technology and Science (BITS), Pilani, and a Master’s in Electrical and Computer Engineering from University of California, Davis.
CHIEF PRODUCT OFFICER (ACTING)
Ashok Madanahalli
Ashok Madanahalli brings 30+ years of experience in networking and cybersecurity at industry leaders such as Riverbed, Check Point, Extreme Networks, and FORE Systems where he built and led high-performance teams delivering product and market share leadership. At Riverbed, Ashok served as Vice President of Product Management (WAN Optimization and SD-WAN) leading the business transformation to Cloud and SaaS. He has also led Firewall/VPN/UTM and IDS/IPS solutions. Ashok holds a master’s degree in engineering from University of Oklahoma and a bachelor’s degree from National Institute of Technology, Durgapur, India.
FOUNDER AND DIRECTOR OF ENGINEERING
Trevor Gudmundsen
Trevor leads Ennetix’s efforts on full-stack design and development of the company’s analytics pipeline. He manages the operations of Ennetix platforms across its customer base.
Todd pioneered the field of network security monitoring in the 1990s with the development of the first widely deployed intrusion detection system, the Network Security Monitor (NSM). In addition to network-based security, he has developed intrusion detection sensors for Windows, Linux, and macOS. Todd is currently focused on bringing innovative network and endpoint security monitoring solutions to Ennetix’s xVisor platform.
Pulak Chowdhury, Founder and CTO, Ph.D., Computer Science, UC Davis
Pulak brings a unique combination of deep networking technology background with advanced research work in Computer Sciences. He provides overall architectural direction and drivers the development activities on xVisor with a highly talented team.
Prof. Dr. Bis Mukherjee, Founder and President (also Distinguished Professor, UC Davis), Ph.D., Electrical Engineering, University of Washington, Seattle, B.Tech. (Hons.), Electronics Engineering, Indian Institute of Technology, Kharagpur
Acknowledged authority in pioneering network technologies for 35+ years. His pioneering contributions in the networking world include:
Network Intrusion Detection System (1990)
Firewall (1989)
Dynamic bandwidth allocation for EPON/FTTH (2002)
Optical-wireless integration (2007), now 5G Fronthaul


