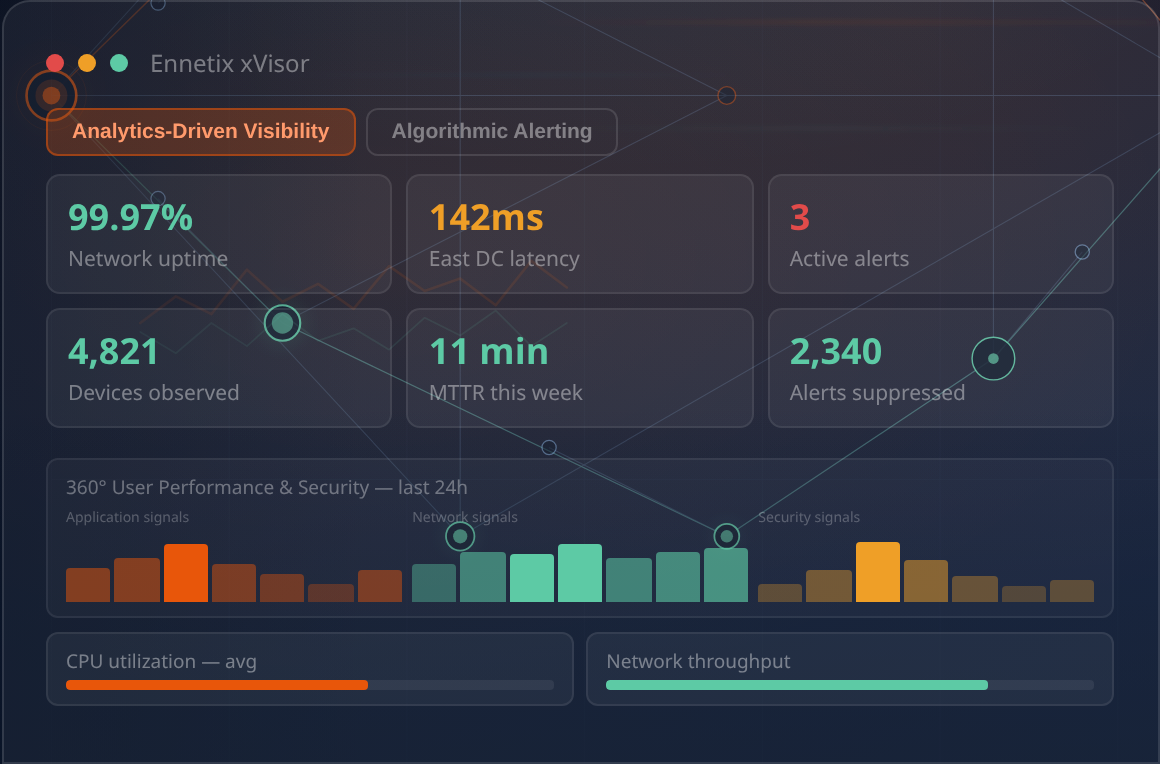
See Everything.
Ennetix Unifies IT Performance And Security Observability On A Single AI-Powered Platform — So Your Teams Detect Anomalies, Isolate Root Causes, And Act Faster Than Ever Before.
IT Tools In Use Today Are Broken
IT Teams Run Multiple Disconnected Tools, Yet Still Miss Outages, Drown In Alerts, And Spend Hours Finding Root Causes That Should Take Minutes To Detect.
Disconnected Tools
IT operations teams often work across multiple dashboards that do not share context with each other.
Alert Fatigue
High alert volume makes it difficult for teams to separate real operational signals from background noise.
Root-Cause Analysis
Teams spend valuable time manually correlating telemetry across separate systems while service impact grows.
Downtime Impact
Service disruptions affect users, operations, and trust when teams cannot detect and resolve issues fast enough.
Shared Context
Performance and security teams operate in separate silos — blind to each other’s signals.
Tools Built For Yesterday
Legacy monitoring tools weren’t designed for hybrid infrastructure, cloud-native apps, or AI-driven operations.
Everything Your IT And Security Teams Need — Unified
Unified Observability
AIOps Intelligence
Network Observability
Security Observability
Automated Root-Cause Analysis
Predictive Intelligence
Explainable AI
User & Entity Behavior Analytics (UEBA)
From Signal To Resolution — In One Continuous Loop
Observe
Detect
ML baselines surface real anomalies and collapse thousands of alerts into a single incident.
Correlate
Analyze
Act
Improve
Built For The Environments You Actually Manage
Enterprise
Academia
Government
ISP / Telco
Not Just Another Monitoring Tool. A Different Philosophy.
Ennetix xVisor is designed from the ground up for the complexity of modern IT – grounded in many decades of R&D at major universities, not retrofitted from decade-old architectures.
Built for complex environments
Performance + security, unified
Dramatically reduces alert fatigue
Faster incident response
Proactive, not reactive
Actionable insights via generative & agentic AI
Credibility Built On Outcomes, Not Promises
Clients