
DDoS via DNS at a Large Enterprise
October 19, 2023
Digital Experience Assurance : Public Cloud User Experience Monitoring
March 14, 2024According to Wikipedia, Situational Awareness is “the understanding of an environment and its elements, and how it changes concerning time and other factors. Situational Awareness is important for effective decision-making in many environments”. In the case of an IT infrastructure of an organization, the goal of Situational Awareness with Ennetix xVisor is to provide information on:
- What are the entities on the network?
- How many unique IP addresses are active,
- How many unique TCP/IP servers are active,
- How many unique user accounts are active, etc.?
- What behaviors does each entity exhibit (suggesting entity type)?
- Personal computer,
- Fixed server (DNS, SSH, HTTP, …), etc.
- Are any of these behaviors a concern?
- Scanning,
- Consistent connection failures.
- Have any entities recently changed their behaviors?
The Situational Awareness data we will be showing here is based on an actual customer’s data for February 2023. This organization is a good representative of many such organizations. Here are a few factors that make this customer site look like many other sites:
- Most of the addresses are in a private address block,
- Most devices in the private address block are user devices,
- Additional services are hosted at an off-site data center, etc.
1. Overview of xVisor Threat Analytics Dashboard
In this case study, we present “Situational Awareness” information of an organization. We start with a whirlwind tour of the major elements of the xVisor’s Threat Analytics Dashboard.
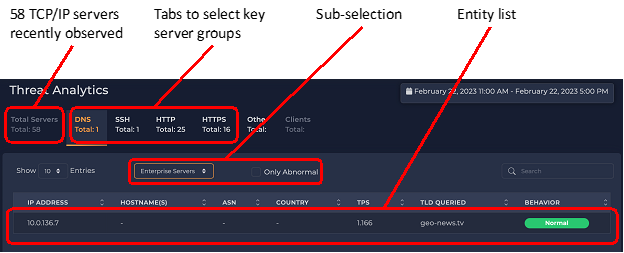
xVisor tracks two types of related entities – active TCP/IP servers (as seen by the traffic analysis they receive) and IP addresses, which typically correspond with devices active on the network. As of the last hour (when this screen shot was captured), we saw 58 active TCP/IP servers on their network. We then highlight several key services in tabs. Each service is clickable, letting us drill down into more detail. In addition to the service group, we can select a sub-group. The default sub-group is “enterprise servers”. Below the sub-group is a list of IP addresses matching the service group and sub-selection (the “entity list”).
2. DNS Servers and Clients
Here the DNS tab is selected. We see there was only one server identified recently. This number will fluctuate depending on what traffic has been observed. The default sub-selection of “Enterprise Serves” is selected. Other sub-group options are displayed on the right.
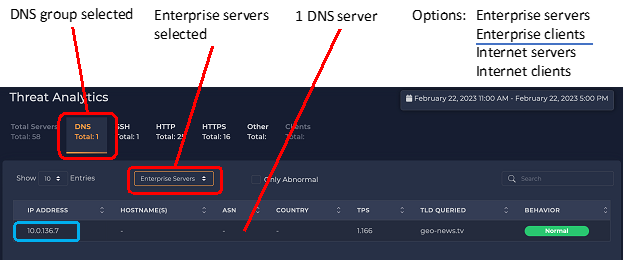
The one enterprise DNS server observed is 10.0.136.7. The requests to this server that we can see are at a relatively low rate of about 1 DNS request per second.
There may be, and probably are (as we will see in the next illustration) many internal requests made to the server that we cannot see.
An IP address can be both a client and a server, and a single IP address can host multiple service types (e.g., DNS, HTTP, and SSH).
Now, we switch to the “Enterprise Clients” sub-group – IP addresses that make DNS requests that we can see. Here, we see the same IP address, 10.0.136.7, making DNS queries too. The query rate is about 70 times higher than the queries we see it receiving (here it is making 72 DNS requests per second).
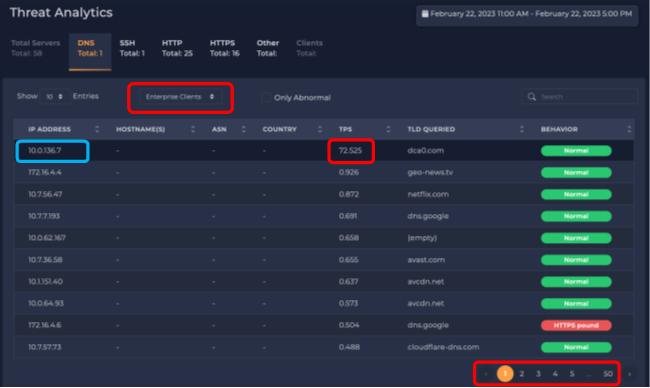
We also see many IP addresses making DNS queries of their own, but most of them at only a fraction of the rate of the topmost server. At the bottom, we see there are 50 pages of addresses. This means there are about 500 addresses bypassing the internal DNS server (10.0.136.7). This is about 10% of the addresses in the organization. (We have seen this number fluctuate.) Whether this is a good or a bad thing depends on the organization’s policy. For example, if the organization has a “DNS firewall” that blocks queries for known malicious domains, any internal device bypassing the organization’s primary DNS server loses the protection of this “DNS firewall”.
3. SSH Servers and Clients
Switching to the SSH tab, we again see that there is only one SSH server in the enterprise. Selecting it and looking at one particular hour, we note that it accepted 658 connections. Again, this could be a concern or acceptable depending on why the server is receiving 600+ connections every hour. For example, we see similar activity when a client uses secure copy of SSH to transfer many files.

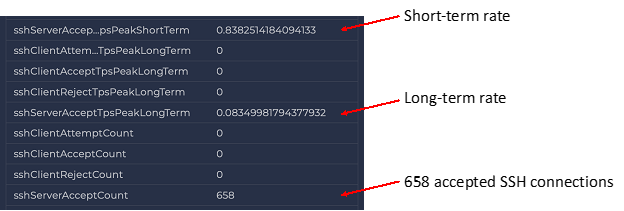
However, we more often see this when remote addresses are looking for servers to break into, and once they find an active server, they repeatedly try account-and-password combinations to gain access to the machine.
Switching to the “Internet Client” sub-group view, we see who is connecting to the SSH servers, and we see about 420 different IP addresses from all over the world connected to this server.
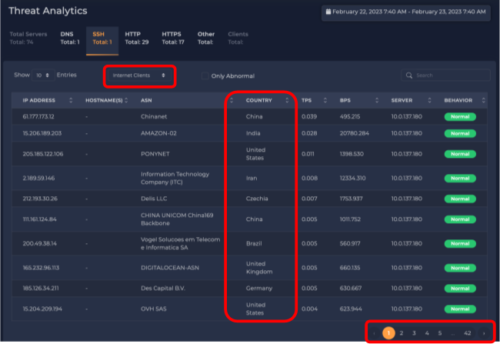
Let us drill down to see the behavior of one of those remote clients, namely the address 16.177.173.12. One geolocation service shows this address is in China; however, at least one other geolocation service shows this address in Australia. (NOTE: Geolocations for IP addresses are always in flux and can be hard to pin down).
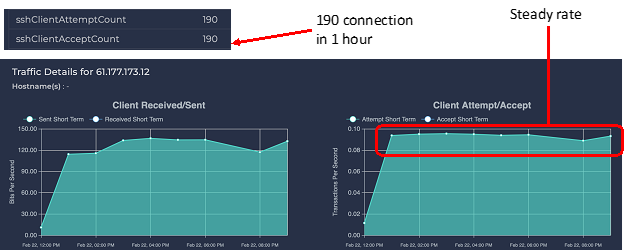
We see that the remote client (16.177.173.12) made a steady rate of connections every hour for many hours. Looking at more detail, we see in one hour 190 connections were made, and all 190 were accepted. This does *not* necessarily mean the remote connection was able to log in, transfer files over secure copy, etc. It only means that the connection was accepted. The SSH server would then challenge the client for good credentials (e.g., account and password) before letting the connection reach further into the system. With so many connections every hour, the remote address was (most probably) trying to guess account-and-password combinations.
4. HTTP Servers and Clients
Now we have selected the HTTP tab; 29 HTTP servers were recently observed. 10.0.137.56 is the most popular server, receiving 15 connections per second. But this HTTP server is showing an unusual behavior, something we call “SSH pound.”
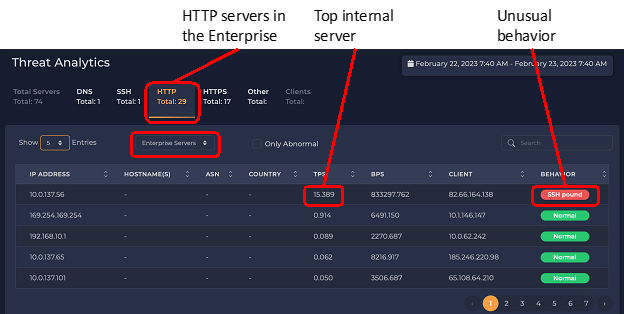
“SSH pound” is a behavior where an address repeatedly makes many connections to a single remote IP address, but the connections fail. This can indicate malicious activity or a network problem that should be resolved. An example of malicious activity is a host launching a Denial-of-Service attack by flooding a server with requests. An example of a network problem is a host trying to connect to an SSH server that is down or unreachable (e.g., blocked by a firewall). xVisor has often seen examples of the latter – a service that was blocked, so legitimate activity was failing, and network administrators were never aware of this problem.
5. Failed Service?
The next illustration shows some details of those SSH connections. The device (apparently the web server at 10.0.137.56) made 202 connection attempts in one hour. None of the connection attempts were accepted. The destination address was 45.140.141.212 – a computer in the Netherlands. Some details about the host are shown on the right.

6. Conclusion
A major goal of xVisor’s Security Dashboard is to provide Situational Awareness, which, for the organization considered in this document, can be summarized as follows:
- 10.0.136.7 is the organization’s primary DNS server, forwarding requests for many internal devices, but about 10% of organization’s IP addresses bypassed this DNS server and made queries directly to the Internet.
- The SSH server is being connected from all over the world, receiving hundreds of connections per hour. Some hosts were making large numbers of connections to it.
- The most popular HTTP (web) server made large numbers of outbound SSH connections to an address in the Netherlands. None of the connections in the hour we reviewed were successful.
For this organization, through Situational Awareness, xVisor finds all the active entities in the network, and their behaviors, and exposes some important behaviors that demand the next round of investigations. That is left for another case study: Root-Cause Analysis of xVisor!


