

Digital Experience Assurance for Online Learning: Why “Good Enough” Network Performance Is Not Good Enough Anymore
April 29, 2026
How AIOps Transforms Network Anomaly Detection: From Threshold Alerts to Predictive Intelligence
May 27, 2026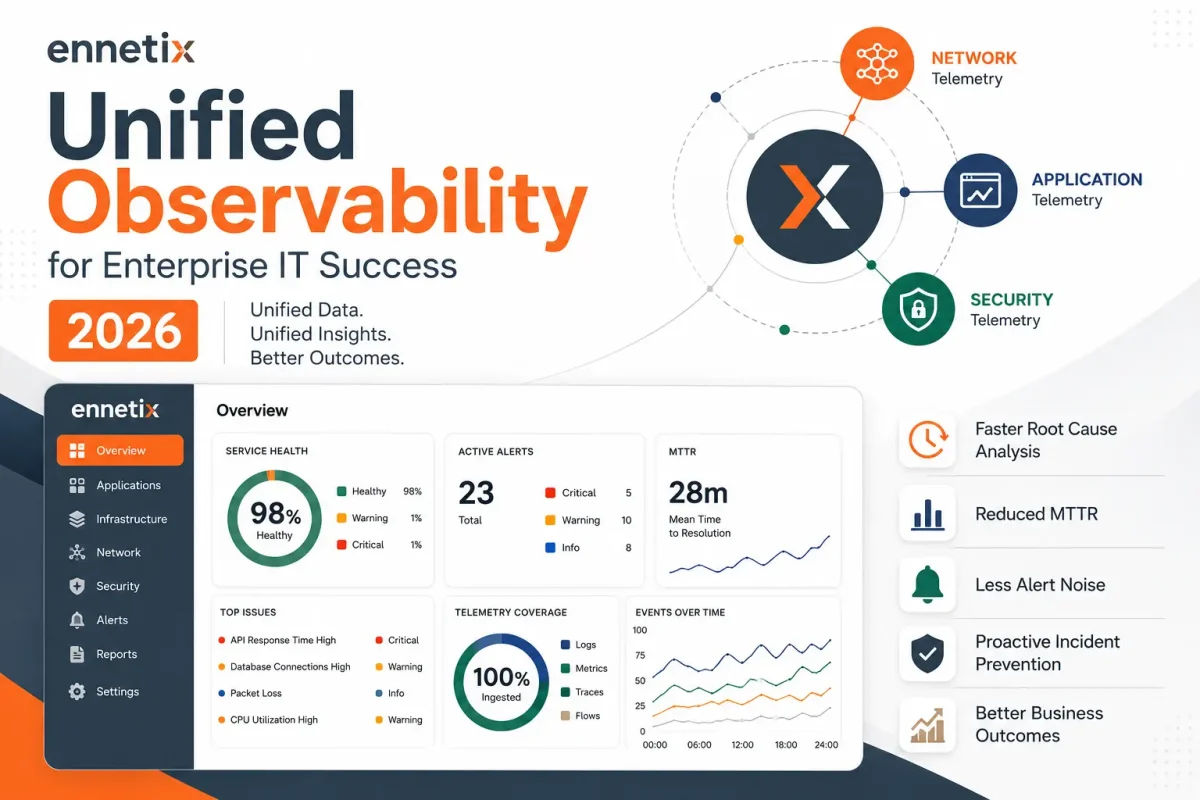
The Monitoring Problem No One Talks About Honestly
Every enterprise IT leader has lived through the same scenario: an application goes down, three teams point fingers at one another, and the incident drags on for hours while dashboards across five different monitoring tools show five different stories. Nobody is lying. Each tool is accurate. But none of them is telling the complete story.
This is the fundamental problem with siloed monitoring. And it is one of the most expensive, most avoidable operational failures in modern enterprise IT.
According to Ennetix’s platform research, the average cost of a network-caused outage is $165,000, while a full data breach averages $4.35 million. The network is the number one cause of outages, and nearly 50% of disruptions cause measurable productivity loss. These are not just IT metrics — they are business metrics. And they are driven, in large part, by the inability of fragmented monitoring tools to provide a coherent picture of what is happening.
This blog explores why enterprise IT teams are making the strategic move to unified observability, what it actually means to unify telemetry, and what to look for when evaluating a platform.
The Real Cost of Siloed Monitoring Tools
Most enterprise IT environments did not become siloed by design. They became siloed by accumulation. A network performance monitoring tool was deployed. Then an application performance management platform. Then a log aggregation solution. Then a cloud monitoring service. Each tool was justified on its own merits. Together, they created an operational nightmare.
The Three Symptoms of Tool Sprawl
The first symptom is context-switching overhead. During an incident, engineers must manually correlate information from multiple dashboards and tools. Each tool speaks its own language, uses its own alert taxonomy, and retains its own slice of telemetry. The time spent translating across tools is time not spent resolving the incident.
The second symptom is alert duplication and noise. When a single infrastructure event occurs — say, a degrading network switch — it can trigger cascading alerts across every tool that touches the systems depending on that switch. The NOC team receives fifty alerts. The root cause is one. The operational cost is fifty investigations.
The third symptom is accountability gaps. When every team has a different view of the same incident, the result is the blame game. The network team says the network is fine because their tool shows green. The application team says the API is responding. The cloud team says the compute layer is healthy. Each team is correct within the limits of their tool’s visibility. But the system is still down.
Monitoring vs Observability: A Distinction That Matters
The terms are often used interchangeably, but they describe fundamentally different operational philosophies.
Monitoring tells you whether a system is behaving within expected parameters based on predefined metrics. It answers: Is CPU utilization above 80%? Is packet loss above 1%? Did the service respond in under 200ms? Monitoring is reactive and threshold-driven. It tells you when something crossed a line.
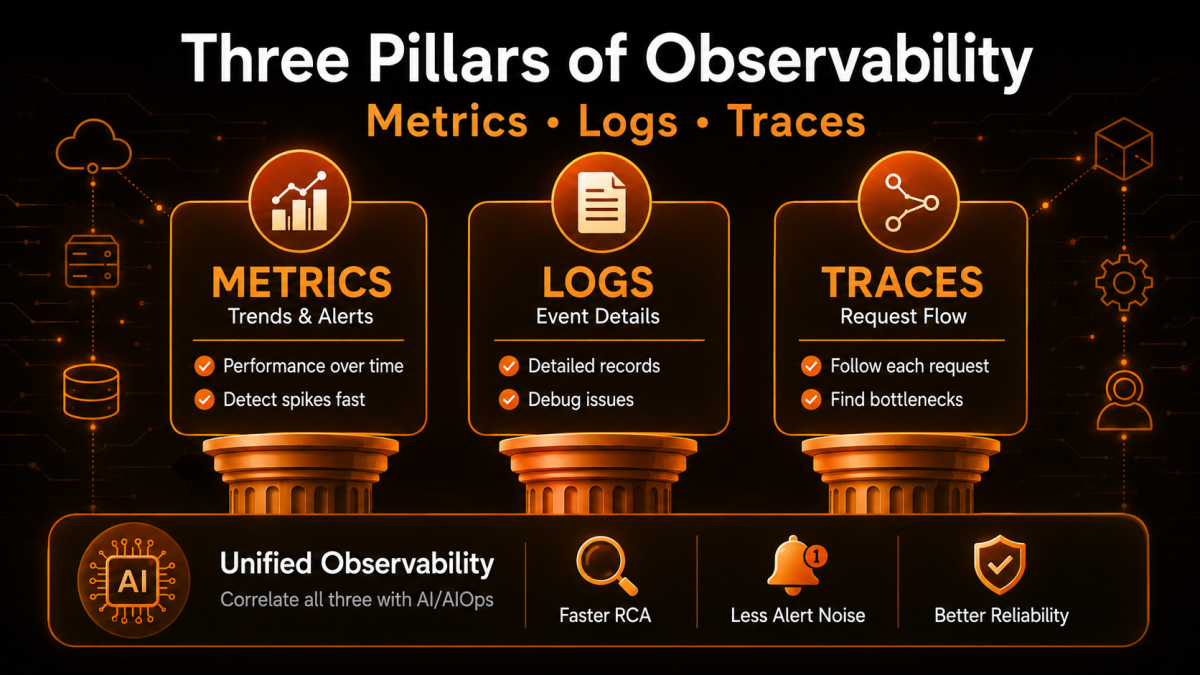
Observability, by contrast, is the ability to understand the internal state of a system by examining its external outputs. It does not just tell you that something went wrong. It tells you why it went wrong, which components are involved, and what the downstream impact looks like. Observability is built on three foundational telemetry types: metrics, logs, and traces.
The Fourth Pillar Emerging in 2026
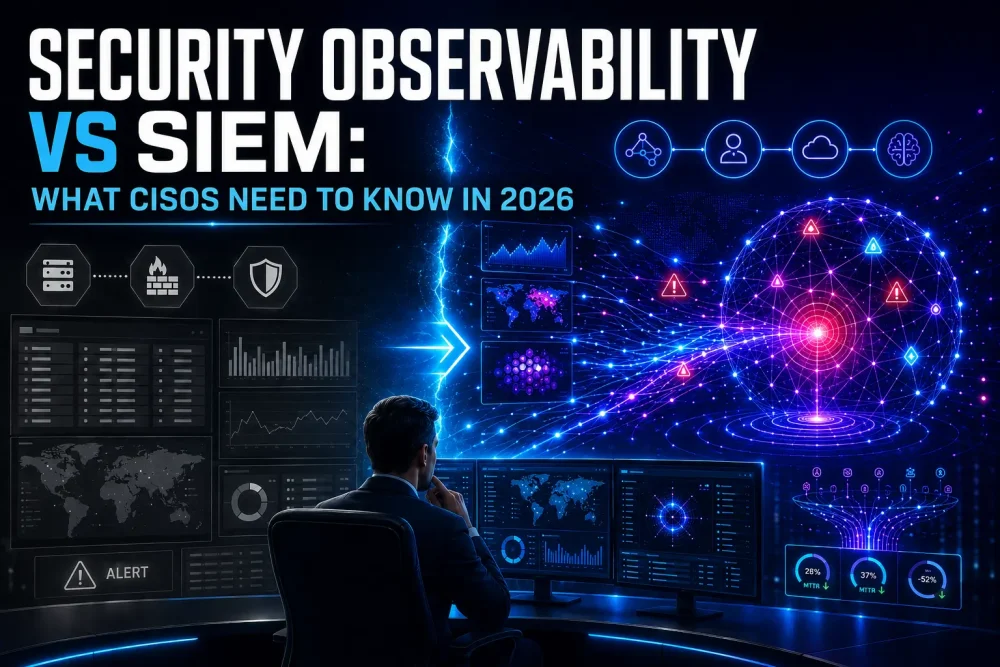
In 2026, a fourth telemetry type is becoming increasingly critical in enterprise environments: security signals. As the boundary between IT performance monitoring and security monitoring continues to blur — a network anomaly may simultaneously indicate performance degradation and an active threat — platforms that can ingest and correlate security telemetry alongside performance telemetry offer a significant operational advantage. This convergence is the defining characteristic of the next generation of observability platforms.
What Unified Observability Actually Delivers Cross-Domain Correlation at Speed
The core operational benefit of unified observability is the elimination of manual correlation. Instead of three teams comparing notes across separate tools, a unified platform automatically correlates signals from the network layer, the application layer, the infrastructure layer, and — in advanced implementations — the security layer.
When an application slowdown is traced automatically to a degraded optical fiber three network hops upstream, the time-to-resolution changes from hours to minutes. The teams stop arguing about what they see in their tools and start acting on a shared, accurate picture of reality.
Proactive Anomaly Detection, Not Reactive Alerting
Unified observability platforms powered by AI and machine learning can establish dynamic behavioral baselines across all telemetry types. Instead of alerting when a metric crosses a static threshold, these platforms identify when behavior deviates meaningfully from established patterns — even when that deviation does not trigger any individual rule.
This is the difference between a platform that tells you the application is down and a platform that tells you the application is about to degrade because traffic patterns and device behavior over the past six hours match historical precursors to an outage.
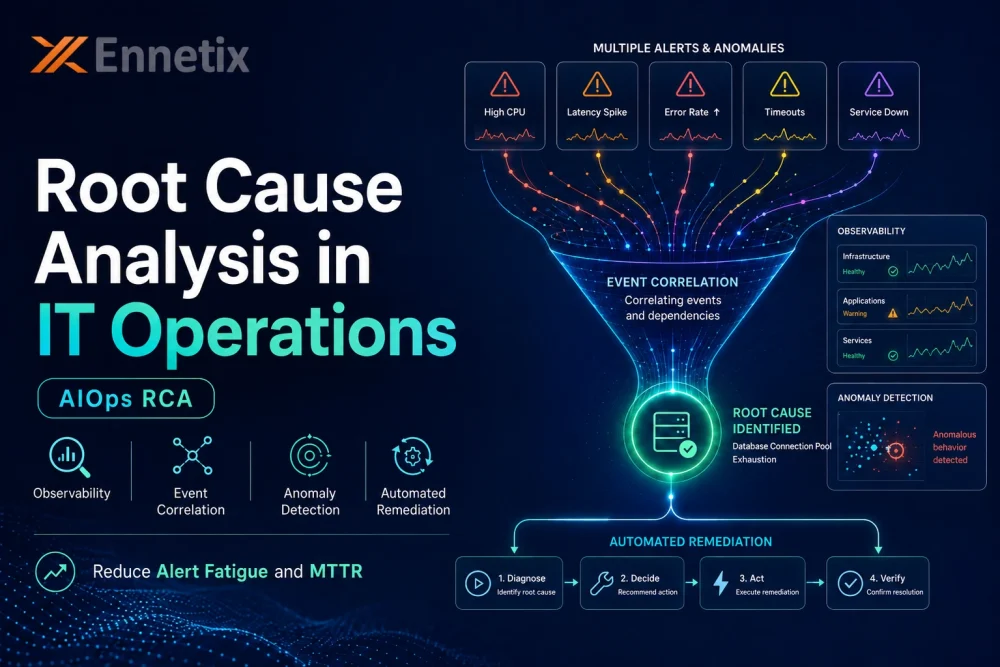
Reduced MTTR Through Automated Root Cause Attribution
The combination of cross-domain correlation and AI-driven analysis enables automatic root cause attribution — not just anomaly detection. A platform can identify not only that something is wrong, but specifically which component is responsible, which systems are affected, and what the probable remediation steps are. This reduces mean time to resolve (MTTR) dramatically, in some cases from weeks to hours or from hours to minutes.
Why the Business Case for Unification Is Compelling
The operational benefits of unified observability translate directly into business outcomes that C-suite leaders and boards can understand.
First, reduced outage frequency and duration directly maps to revenue protection. For organizations where an hour of downtime costs six figures, even a modest reduction in incident frequency and duration produces a significant return on the platform investment.
Second, IT staff retention improves when engineers are no longer spending their working hours in alert triage hell. Alert fatigue is a primary contributor to burnout in NOC and engineering teams. Platforms that reduce alert noise and provide clear root cause context restore the operational experience to one focused on problem-solving rather than noise management.
Third, compliance and audit posture improves when all telemetry flows through a single, auditable platform with consistent data retention policies and access controls. Fragmented tools create fragmented audit trails — a significant liability in regulated industries.
What to Look for in a Unified Observability Platform
Not all platforms that claim to offer unified observability actually deliver it. When evaluating options, enterprise IT teams should ask the following questions:
- Does the platform ingest telemetry from all relevant domains — network, application, infrastructure, cloud, and endpoints — natively, without requiring extensive custom integration?
- Does the AI or ML layer provide explainable outputs? Can an engineer understand why a specific anomaly was flagged or why a particular root cause was attributed?
- Does the platform scale to the number of nodes, flows, and events in your environment without degraded performance or prohibitive cost escalation?
- Does the platform support your deployment model — whether cloud-native, on-premise, hybrid, or multi-cloud?
- Does the vendor have domain expertise in network-centric observability, not just application performance monitoring rebranded as a full-stack platform?
Conclusion
The shift from siloed monitoring to unified observability is not a trend — it is a structural response to the reality that modern enterprise infrastructure is too complex, too interconnected, and too consequential for any single-domain monitoring tool to manage effectively.
Organizations that continue to operate with fragmented monitoring stacks will continue to absorb the operational and financial costs of extended outages, alert fatigue, and accountability gaps. Those that move to unified observability will recover from incidents faster, prevent more of them proactively, and operate with a level of clarity that siloed tools structurally cannot provide.
To learn how Ennetix’s xVisor platform delivers these capabilities — from real-time anomaly detection to unified performance and security observability — schedule a personalized platform demonstration with the Ennetix team.
FAQs
Monitoring tells you when something crossed a predefined threshold. Observability tells you why it failed — which components are involved, what the downstream impact is, and what to do next. Monitoring is reactive; observability is contextual and causal. See how this plays out in practice on the xVisor Platform page.
Each siloed tool captures only its domain — network, application, or infrastructure — so engineers must manually correlate across dashboards during an incident. That translation overhead is where hours are lost. Unified observability eliminates it by automatically linking signals across domains into a single root cause. Learn how AI drives this in How AIOps Transforms Network Anomaly Detection.
In 2026, security signals are the fourth telemetry pillar alongside metrics, logs, and traces. A network anomaly can simultaneously indicate performance degradation and an active threat. Platforms that correlate security and performance telemetry together surface both pictures in one place — eliminating the NOC-SOC handoff delay covered in Alert Fatigue in NOC and SOC Teams.
Five things: native multi-domain telemetry ingestion, explainable AI outputs, deployment flexibility (cloud, on-prem, hybrid), ITSM/SOAR integration, and genuine network-centric expertise — not APM tools rebranded as full-stack. Ennetix's Automated Root Cause Analysis page and Audits and Compliance page cover two of the most-evaluated capabilities in detail.


