Hardening the Mac: Safeguarding Your Digital Life
August 27, 2024
Preventing Security Breaches: How Ennetix Solutions Strengthen IT Security Audits
November 30, 2024The Work-from-Home (WFH) situation was forced on many of us when the Covid-19 pandemic disrupted our lives. This is when I started having poor digital experience during work, not only during online meetings (with colleagues complaining about my frozen video and jittery audio) but also – quite frequently – slow responses from various applications, which were generally running well when I was at the office. Given that my company (Ennetix) provides “Holistic Observability” and “Situational Awareness” of an IT infrastructure, through its xVisor platform, I decided to deploy this solution in my home (although it is primarily an enterprise product) to see what might be going on in my home IT environment.
[As an aside, with my colleagues assisting me remotely, I was able to install the solution in my home with reasonable effort. I had to set up a mini-PC, connected to my home’s Residential Gateway, so that it can act as an agent or data collector, do some data preprocessing, and send summarized information to the xVisor Cloud instance for my home for actual data analytics.]
Now my detective activity could start!
The Landing Page of xVisor (for my home) showed the various applications being used in my home, not only by me but also by other occupants of my home, viz. my wife (see Fig. 1). xVisor shows close to 30 Discovered Apps in my home network (and I had no idea that there would be so many apps, some of which are probably running in the background, and hopefully not doing anything nefarious!). xVisor allows me to select some apps for detailed monitoring… and, here, one should be cautious about selecting only a few (say 5) mission-critical apps or else the data volumes generated and analyzed (by xVisor’s Cloud instance) can become huge!
As one can see, the app with the highest data volume during the activity represented in Fig. 1 is Internet Message Access Protocol over TLS/SSL (which was actually my Gmail app). I had selected this IMAP/Gmail app (as well as a few other apps) for Detailed Monitoring (as indicated by the “>>” sign on the right-most column of the various rows).
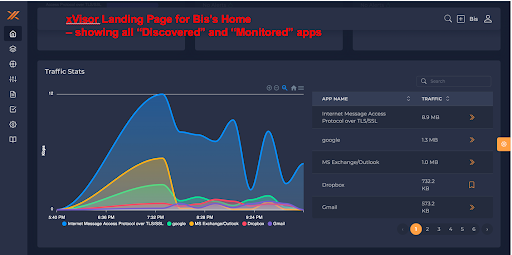
Figure 1: xVisor Landing Page for my home… showing all “Discovered” and “Monitored” apps.
For each app selected for Detailed Monitoring, xVisor provides many aspects that are monitored, discovered, and measured; but let me focus on the “Path Performance” measurement of the app. Using a patented and proprietary packet-train technology and with instrumentation only at the client side, xVisor creates a “Google-map view” of the path (at Layer 3) from the client side to the server (IMAP/Gmail in this case) (see Fig. 2). Specifically, the path shows the domains over which the traffic flows from the client side to the server (viz. Home Network, ISP Network, and Cloud Service Provider (CSP) Network in this case); the sequence of routers in each of these domains; delay, jitter, and packet-loss rate (PLR) on each hop; as well as the end-to-end delay, jitter, PLR, and available bandwidth. Red color on a link indicates a problem on the link (e.g., very high delay relative to normal) while red color on a node indicates a problem with that device (router) (e.g., high PLR on one of its interfaces). [This packet-train technology is like traceroute on steroids, but note that standard traceroute and pings will be blocked by several routers and domains.]
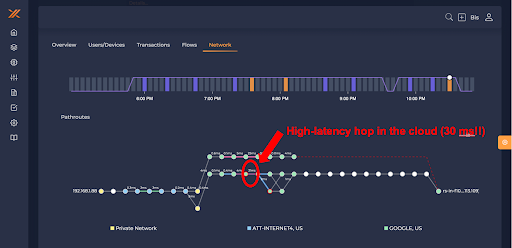
Figure 2: Path performance (with Google-Map-like view) from my home to the IMAP/Gmail server. [Note
the offending high-latency hop.]
As one can see in Fig. 2, most links have small delay (sub-milliseconds to a few milliseconds); but, when we get to the Cloud Network, there is a link with very high delay… over 30 ms!! This high-latency hop (at Layer 3) must be causing problems, i.e., more packet retransmissions, at the transport layer (Layer 4), thereby leading to high end-to-end (e2e) delay (of nearly 400 ms!!) at the application layer (see Fig. 3)! Note that the typical e2e delay expected for such applications is in the 50-60 ms range, or even less (based on our experience and other measurements)!
So, here is my diagnosis for the root cause of my poor digital experience. Often times (though not always), my quality of experience has been suffering due to high end-to-end delay for some of my mission-critical applications, which has been due to a high-latency hop on the path from my home to the application server.
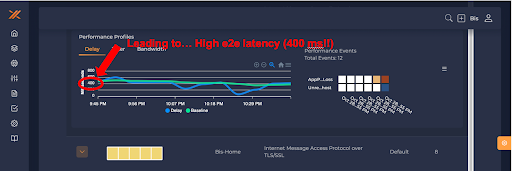
Figure 3: High end-to-end (e2e) delay… which should be in the 50-60 ms range (instead of 400 ms!!)
[If we had access to data from the lower layers, e.g., physical / optical layer, we could try to correlate if the high latency in the offending hop at Layer 3 was caused by issues at the Link Layer or poor (optical) signal quality at the Physical Layer. That is, the above cross-layer correlation we performed across the Application, Transport, and Network Layers can be extended to the Link Layer (5G, perhaps?) Physical Layer also if additional appropriate data was available.]
If I could conduct this detective work, I am sure you can do so as well. For further information, please visit https://ennetix.com; or contact bis@ennetix.com or info@ennetix.com.

