Introduction: When Every Alert Feels Like a False Alarm
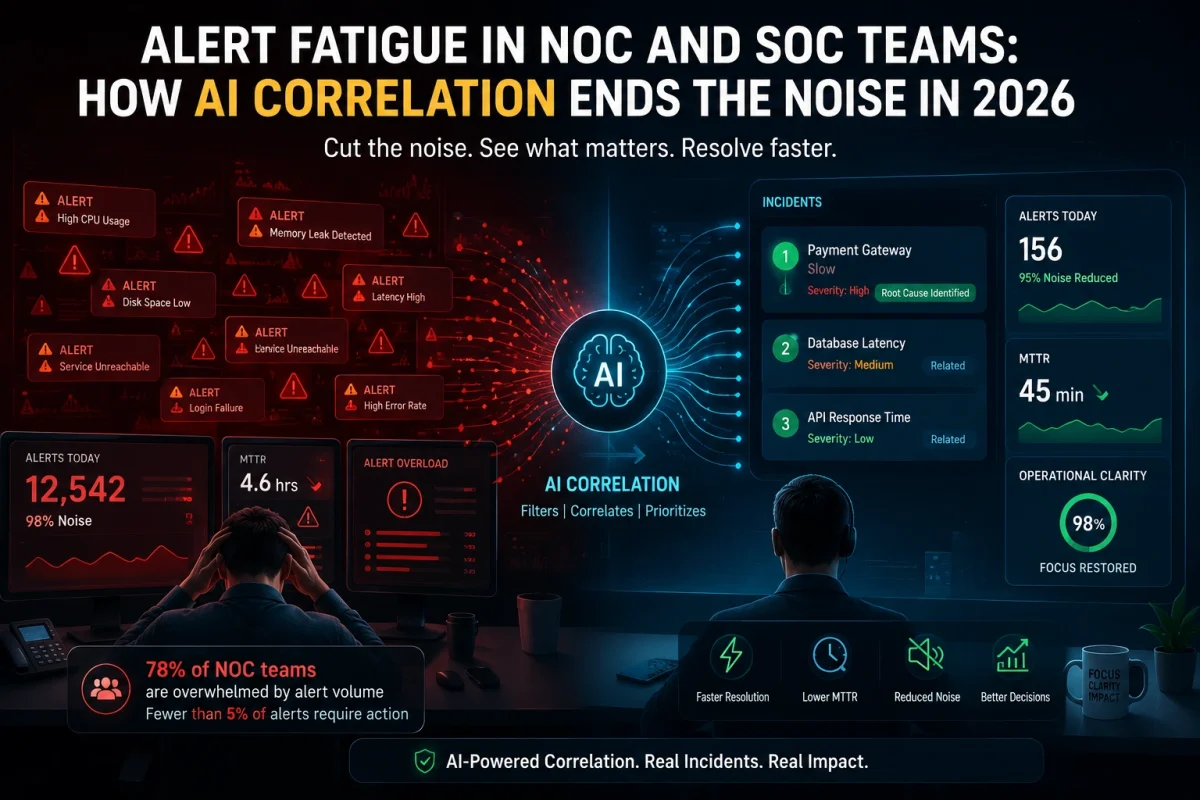
Ask any experienced NOC or SOC engineer about their day, and the response is often the same: a relentless stream of notifications, the majority of which turn out to be false positives, expected operational events, or redundant duplicates of an alert that fired forty times already.
Alert fatigue is the state that emerges when monitoring systems generate more alerts than human teams can meaningfully evaluate. It is one of the most pervasive and dangerous problems in modern IT operations — and it has grown progressively worse as enterprise environments have become more complex.
A 2025 survey by OpsRamp found that 78% of enterprise NOC teams report experiencing significant alert fatigue, with the average team receiving over 10,000 alerts per day. Of those, fewer than 5% require immediate human action. The rest is noise.
Understanding Alert Fatigue: It Is More Than Too Many Notifications
The Anatomy of an Alert Storm
In a complex enterprise environment, a single infrastructure event rarely generates a single alert. Consider a network switch experiencing port degradation. The switch generates an SNMP trap. The ten servers connected to that switch report elevated latency. The applications running on those servers report timeout errors. The databases behind those applications report connection failures. The end-user monitoring system reports degraded experience scores. The security tool reports anomalous connection patterns.
One root-cause. Potentially hundreds of alerts. Each alert arrives in a different tool, with a different format, at a different severity level. The NOC team must investigate each one. By the time the actual root-cause is identified, the incident has been running for hours and the team is exhausted.
The Human Cost: Burnout and Attrition
Alert fatigue is a leading contributor to burnout among NOC and SOC engineers. The psychological cost of constant interruption — especially during on-call rotations — is significant. Engineers develop a conditioned response to deprioritize alerts, knowing from experience that most will be noise. This cognitive adaptation is a rational survival mechanism. It is also operationally dangerous. When a genuine critical incident arrives in the same stream as thousands of false positives, the risk of delayed response is high.
The result is measurable attrition among experienced operations engineers — the people whose institutional knowledge is most valuable and hardest to replace.
The Business Cost: Compliance and Missed Incidents
In regulated industries, missed alerts carry compliance implications beyond operational impact. If an alert was generated but not acted upon, the organization faces audit exposure — regardless of whether the underlying issue resulted in a breach or outage. Alert fatigue creates a documented record of inaction that creates regulatory risk.
Why Common Fixes Do Not Solve the Structural Problem
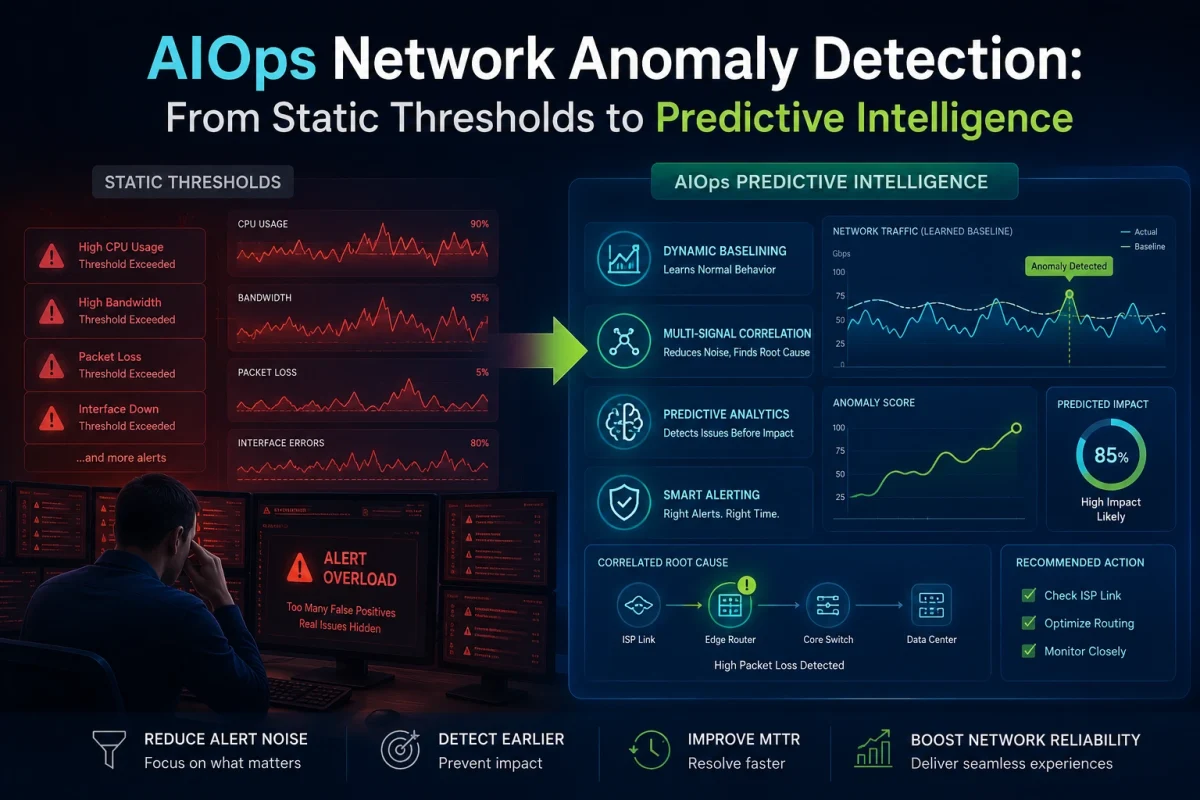
Most organizations have tried to address alert fatigue through threshold tuning, tool consolidation, or expanded staffing. These approaches provide temporary relief but fail at the structural level.
Threshold tuning is manual, time-intensive, and perpetually out of date. As environments change — new services, new workloads, new traffic patterns — manually maintained thresholds drift out of alignment with operational reality. The effort of maintaining them scales with infrastructure complexity.
Adding headcount scales the human layer of the problem but does not reduce alert volume. More engineers reviewing the same noise does not produce better outcomes — it produces the same outcomes with a larger salary budget.
Tool consolidation without intelligence is also insufficient. Routing alerts from five tools into one dashboard reduces the number of places to look, but it does not reduce the number of alerts. The noise is now louder in one place rather than quieter across five.
How AI-Powered Alert Correlation Changes the Equation
Grouping Related Alerts into Unified Incidents
The core capability of AIOps-driven alert management is event correlation — the ability to recognize that hundreds of alerts generated by different systems are all downstream consequences of a single upstream event, and to group them into a single, enriched incident record.
Instead of fifty alerts requiring fifty investigations, the operations team sees one incident with full context: the root-cause (degraded switch port), the blast radius (ten servers, three applications, two database connections), the severity, and the recommended remediation steps. Alert volume drops from hundreds to one. Investigative effort drops proportionally.
Dynamic Baselines: Knowing What Normal Looks Like
AIOps platforms replace static thresholds with machine learning models that establish dynamic behavioral baselines for every monitored entity. A CPU spike that always occurs during a nightly backup window is recognized as expected behavior. The same spike occurring at an unexpected time — or in a pattern inconsistent with any known operational event — is flagged as genuinely anomalous.
This context-sensitivity eliminates the largest category of false positives: expected operational events that cross static thresholds. Industry data suggests organizations deploying AIOps correlation see 80–95% reductions in alert volume within the first 90 days.
Topology-Aware Root- Cause Attribution
When AIOps platforms maintain a real-time model of infrastructure topology and service dependencies, they can trace the propagation path of a failure. A database disk I/O issue is automatically identified as the root-cause of downstream application errors, API timeouts, and user experience degradation — rather than presenting each as a separate alert requiring independent investigation.
Bridging NOC and SOC: When Performance Anomalies Signal Security Threats
One of the most operationally significant shifts enabled by AI-driven alert correlation is the convergence of NOC and SOC context. Performance anomalies and security signals increasingly describe the same underlying events.
A DDoS attack is both a network performance event and a security event. Ransomware encrypting files creates storage performance anomalies and security detections simultaneously. Lateral movement by a compromised endpoint creates unusual network traffic patterns that a performance-focused NOC tool would dismiss as anomalous but non-critical.
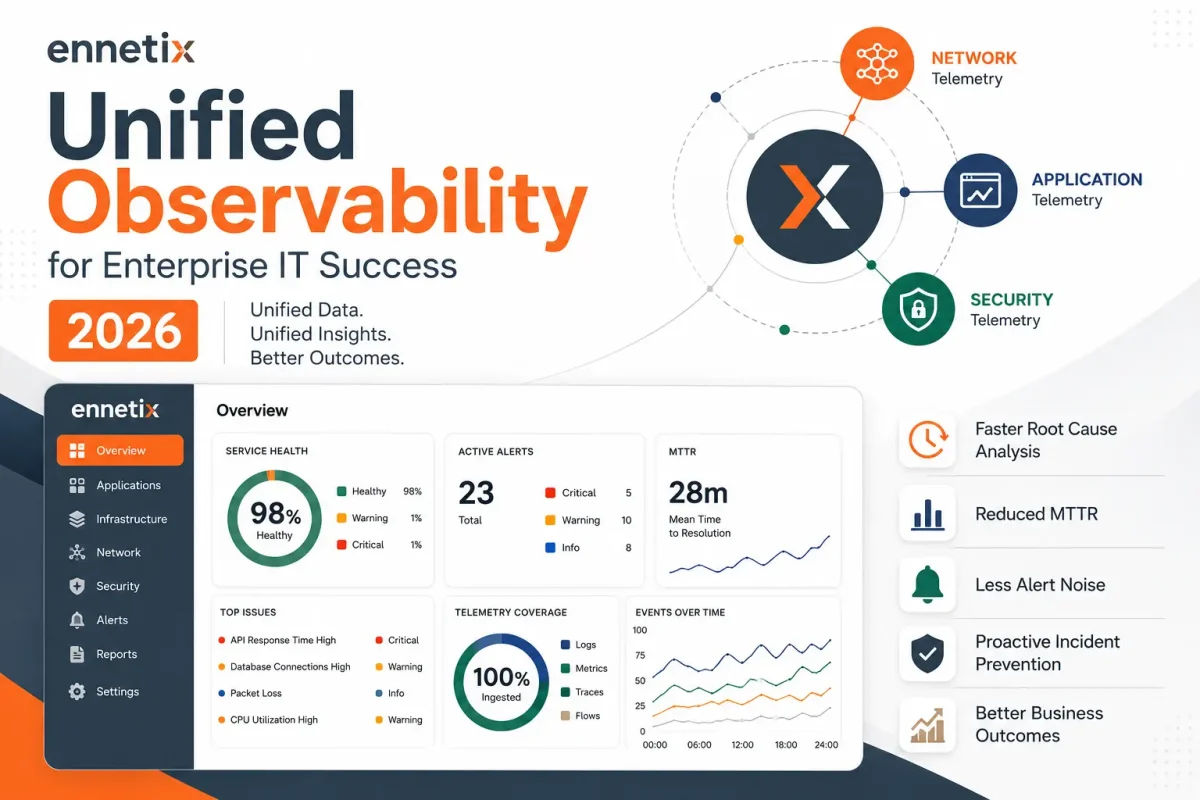
Platforms that correlate across both performance and security telemetry streams surface the full picture — enabling faster containment and reducing the handoff delays that occur when NOC and SOC teams operate in separate tooling environments.
The New Metric: From MTTR to Mean Time to Intelligence
Traditional operations measure success by how quickly an issue is resolved — Mean Time to Resolve (MTTR). In an AI-driven operations model, the more meaningful metric is Mean Time to Intelligence (MTTI): how quickly the system understands the problem, not just reacts to it.
By reducing the time between alert generation and accurate root-cause identification, AIOps platforms make the intelligence step — historically the most time-consuming part of incident response — dramatically faster. Resolution follows rapidly once the team understands what they are dealing with.
Conclusion: From Firefighting to Continuous Operational Intelligence
Alert fatigue is a symptom of a broken operational model — one designed for a simpler infrastructure era and overwhelmed by the complexity of modern hybrid environments. It cannot be solved by tuning thresholds more carefully or hiring more engineers. It requires a structural change in how alerts are generated, evaluated, and acted upon.
AI-driven event correlation, dynamic behavioral baselining, and topology-aware root-cause attribution provide that structural change. They do not simply reduce alert volume — they transform what operations teams receive: not noise requiring investigation, but intelligence enabling action.
To learn how Ennetix’s xVisor platform delivers these capabilities — from real-time anomaly detection to unified performance and security observability — visit ennetix.com or schedule a personalized platform demonstration with the Ennetix team.
Jim Olson served as a Business Specialist at the Engineering Translational Technology Center (ETTC) at University of California, Davis, advising on company formation, strategy,and financing. He also taught classes as an Adjunct Faculty in the Graduate School of Management at UC Davis for over a decade. Previously, he was Executive Vice President of video compression systems at TANDBERG Television and CEO of SkyStream. At TANDBERG, he focused on building and marketing video compression offerings. Jim has held leadership roles at 3Com Corporation and Hewlett-Packard, where he led several successful product launches. He is an active angel investor and a guest lecturer at Stanford University and UC Davis. Jim holds a BSEE from UC Davis, and MSEE and MBA degreesfrom Santa Clara University.
Sudip Nandy is an acclaimed business leader with over 30 years of experience in global strategy, enterprise building, and investments. He is currently a Senior Advisor and has previously served as Managing Director and Operating Partner at ChrysCapital, a leading investment firm. He was Executive Chairman of Infogain Corporation and Board Member at Liquid Hub Inc. Sudip is also a Director on the Board of GeBBS Healthcare. Earlier, he was CEO and Chairman (India) for Aricent. He is the former Chief Strategy Officer and Head of M&A at Wipro, where he led several successful mergers and acquisitions. Sudip holds a Bachelor’s Degree in Physics from the Indian Institute of Technology (IIT), Kharagpur, andanother in Electrical Technology and Electronics from the Indian Institute of Science (IISc),Bengaluru. He also has an MBA from the Indian Institute of Management (IIM), Ahmedabad.
Prem Jain was CEO and Co-Founder of Pensando Systems, a cloud and enterprise data center startup, which was founded in 2017 and acquired by AMD in 2023. Before Pensando, Prem spent 23 years at Cisco Systems, where he was known as the “heart, soul, and brains” behind several successful startups. As the Senior Vice President and General Manager of Insieme BU, he developed Software Defined Networking (SDN/ACI) products and next-generation data-center switches. Prem joined Cisco in 1993 after it acquired Crescendo Communications, where he was Vice President of Systems Architecture. He holds a B.E. from Birla Institute of Technology and Science (BITS), Pilani, and a Master’s in Electrical and Computer Engineering from University of California, Davis.
CHIEF PRODUCT OFFICER (ACTING)
Ashok Madanahalli
Ashok Madanahalli brings 30+ years of experience in networking and cybersecurity at industry leaders such as Riverbed, Check Point, Extreme Networks, and FORE Systems where he built and led high-performance teams delivering product and market share leadership. At Riverbed, Ashok served as Vice President of Product Management (WAN Optimization and SD-WAN) leading the business transformation to Cloud and SaaS. He has also led Firewall/VPN/UTM and IDS/IPS solutions. Ashok holds a master’s degree in engineering from University of Oklahoma and a bachelor’s degree from National Institute of Technology, Durgapur, India.
FOUNDER AND DIRECTOR OF ENGINEERING
Trevor Gudmundsen
Trevor leads Ennetix’s efforts on full-stack design and development of the company’s analytics pipeline. He manages the operations of Ennetix platforms across its customer base.
Todd pioneered the field of network security monitoring in the 1990s with the development of the first widely deployed intrusion detection system, the Network Security Monitor (NSM). In addition to network-based security, he has developed intrusion detection sensors for Windows, Linux, and macOS. Todd is currently focused on bringing innovative network and endpoint security monitoring solutions to Ennetix’s xVisor platform.
Pulak Chowdhury, Founder and CTO, Ph.D., Computer Science, UC Davis
Pulak brings a unique combination of deep networking technology background with advanced research work in Computer Sciences. He provides overall architectural direction and drivers the development activities on xVisor with a highly talented team.
Prof. Dr. Bis Mukherjee, Founder and President (also Distinguished Professor, UC Davis), Ph.D., Electrical Engineering, University of Washington, Seattle, B.Tech. (Hons.), Electronics Engineering, Indian Institute of Technology, Kharagpur
Acknowledged authority in pioneering network technologies for 35+ years. His pioneering contributions in the networking world include:
Network Intrusion Detection System (1990)
Firewall (1989)
Dynamic bandwidth allocation for EPON/FTTH (2002)
Optical-wireless integration (2007), now 5G Fronthaul


