
Why Enterprise IT Teams Are Moving from Siloed Monitoring to Unified Observability
May 15, 2026
Alert Fatigue in NOC and SOC Teams: How AI Correlation Ends the Noise in 2026
June 5, 2026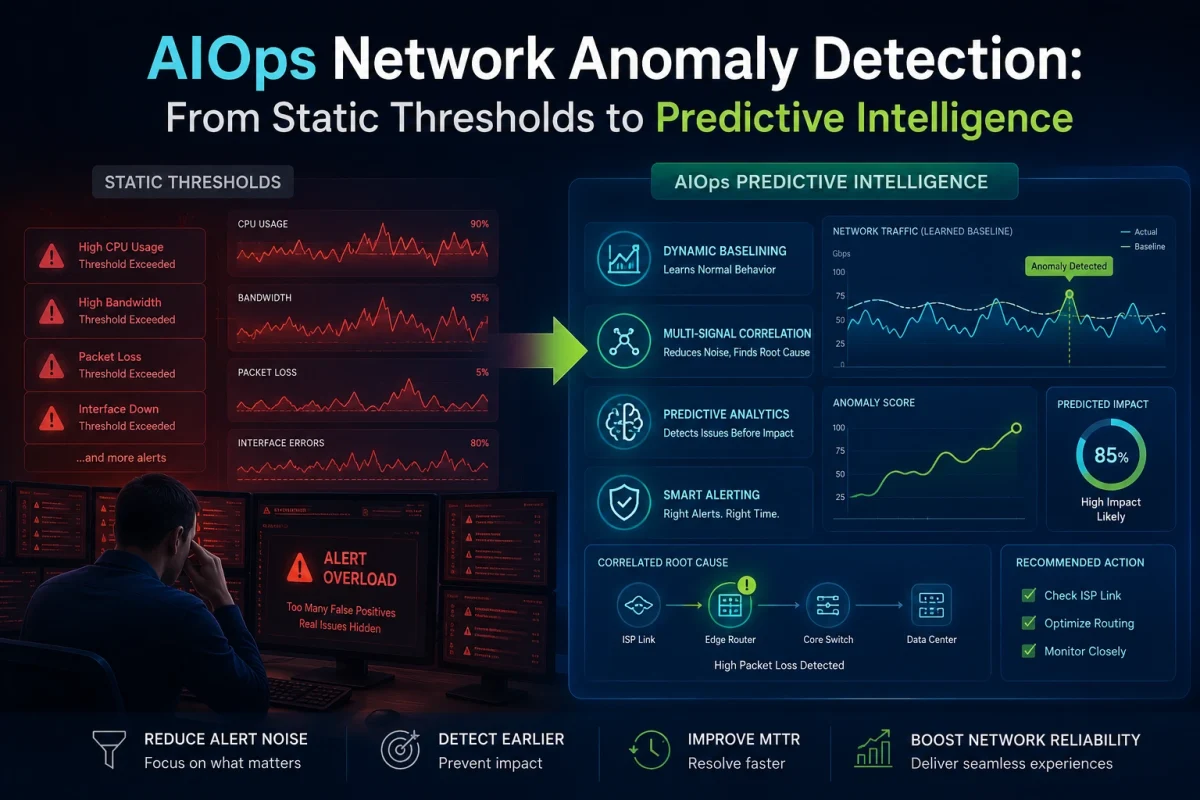
Introduction: The Alert That Cried Wolf
Network operations teams in enterprise environments deal with a paradox: they have more monitoring tools, more data, and more alerts than ever before — and they are more likely to miss a critical incident.
The reason is not a lack of diligence. It is a structural problem with how traditional network monitoring works. Static, threshold-based alerting generates enormous volumes of alerts, the vast majority of which are either false positives, planned operational events, or downstream symptoms of a single upstream cause. Engineers become desensitized. The signal that actually matters gets buried.
AIOps offers a fundamentally different model for network anomaly detection — one built on behavioral intelligence, multi-signal correlation, and predictive pattern recognition rather than static rules. This blog explains how it works and why it represents a genuine operational step change for enterprise network teams.
Why Static Thresholds Fail in Dynamic Environments
Traditional network performance monitoring (NPM) operates on a simple principle: define an acceptable range for a metric, and alert when that metric exceeds the range. CPU utilization above 80%. Packet loss above 1%. Interface utilization above 90%. These thresholds made sense in an era of relatively static, predictable infrastructure.
Modern enterprise networks bear no resemblance to that environment. They are hybrid — spanning on-premises infrastructure, multiple cloud providers, SD-WAN fabrics, and edge locations. They support workloads with dramatically different traffic patterns, seasonal spikes, batch processing windows, and real-time application requirements. A threshold that is appropriate for Tuesday at 2 PM is meaningless for Saturday at 3 AM.
The Cascade Problem
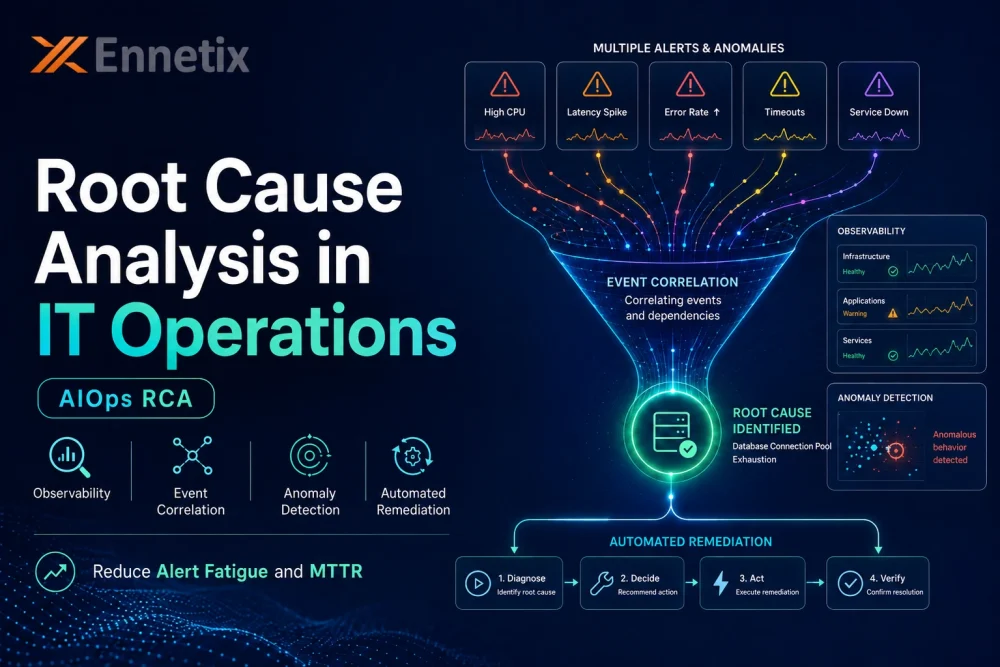
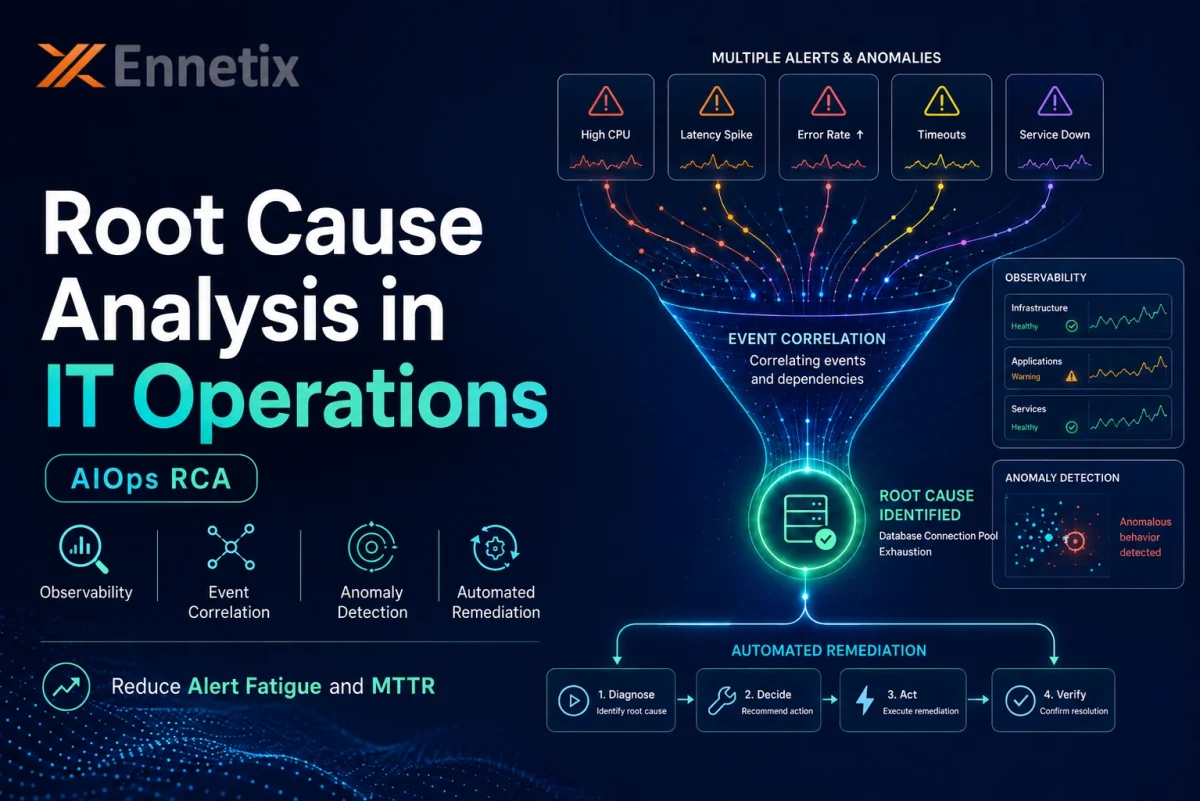
The structural failure of threshold-based alerting is most visible during major incidents. When a core network component degrades — a routing issue, a congested uplink, a malfunctioning switch — every service depending on that component begins generating alerts. An application team sees latency alerts. A cloud team sees timeout errors. A network team sees interface utilization alerts. A security team sees connection failure alerts.
One root cause generates hundreds of downstream alerts, each firing independently, each requiring investigation. The NOC team is buried in noise at exactly the moment when clarity is most needed.
How AIOps Approaches Network Anomaly Detection Differently
Dynamic Behavioral Baselining
Rather than comparing current metrics against fixed thresholds, AIOps platforms learn what normal looks like for each network element, each time of day, each day of the week, and each operational context. A spike in interface utilization on a Monday morning — consistent with weekly backup traffic — is recognized as expected behavior and suppressed. An identical spike at an unexpected time is flagged as an anomaly.
This context-awareness dramatically reduces false positive rates. The platform is not simply applying a rule; it is evaluating the current observation against a learned model of expected behavior.
Multi-Dimensional Signal Correlation
Network behavior is rarely captured by a single metric. A degrading WAN link might manifest as increased latency in one metric stream, higher jitter in another, increased retransmission counts in a third, and subtle changes in traffic flow patterns in a fourth. A static threshold tool evaluates each metric independently. An AIOps platform correlates them simultaneously.
This multi-dimensional correlation allows the platform to detect degradation patterns that no individual metric would identify alone — and to do so earlier in the incident lifecycle, before any single metric has crossed an alert threshold.
Predictive Anomaly Detection: Catching Risk Before Users Notice
The most significant operational capability of AI-driven network monitoring is its ability to identify degradation trends before they produce user-visible impact. Gradual latency drift, incremental memory growth in network devices, slow-building congestion patterns — these are precursors to outages that static monitoring systems ignore until a threshold is breached.
AIOps platforms detect these early warning signals and surface them as low-severity predictive alerts, giving network operations teams the opportunity to intervene during a maintenance window rather than during an emergency.
Practical Scenarios in Enterprise Network Environments
Scenario 1: WAN Performance Degradation
A regional enterprise with offices in four cities is experiencing intermittent complaints from remote workers about slow application response times. The monitoring system shows no threshold violations. An AIOps platform, analyzing traffic patterns, latency distributions, and BGP routing changes simultaneously, identifies that one of the four MPLS circuits is experiencing micro-congestion events — brief, sub-second bursts that no individual metric captures but that create cumulative application performance degradation. The operations team proactively reroutes traffic before the circuit degrades further.
Scenario 2: Security-Relevant Network Anomaly
An endpoint device on the enterprise network begins generating unusual east-west traffic patterns at 2 AM — small, frequent connections to multiple internal hosts that do not match any established communication baseline for that device. The performance impact is negligible. A traditional NPM tool generates no alert. An AIOps platform with behavioral baselining flags the pattern as anomalous and routes it to the security operations team, who identify it as lateral movement by a compromised host.
What to Evaluate in an AI-Powered Network Monitoring Platform
- Explainability: When the platform flags an anomaly, can your engineer understand why? Black-box AI outputs that simply say ‘anomaly detected’ erode engineer trust and operational effectiveness.
- Breadth of signal ingestion: Does the platform ingest NetFlow, SNMP, IPFIX, syslog, BGP events, device telemetry, and application flow data — or only a subset?
- Topology awareness: Does the platform understand network topology and dependency relationships, enabling it to identify root cause and blast radius rather than just flagging symptoms?
- Integration with existing NOC tooling: Does it feed enriched incidents into your ITSM and SOAR platforms, or does it create yet another silo?
- Deployment flexibility: Does it support on-premises, cloud-native, and hybrid deployments to match your environment?
Conclusion: The Shift from Reactive to Predictive Network Operations
The enterprise network is no longer a stable, predictable infrastructure layer. It is a dynamic, multi-vendor, multi-cloud fabric that requires intelligence — not just measurement — to operate effectively.
AIOps-driven network anomaly detection does not simply improve on threshold-based alerting. It replaces the operational model entirely — moving network operations from a reactive posture, where teams respond to breached thresholds and customer complaints, to a predictive posture, where degradation is identified and addressed before any user feels its impact.
For enterprise network operations teams managing hybrid infrastructure at scale, this is not a marginal improvement. It is a fundamental change in what network operations can deliver.
To learn how Ennetix’s xVisor platform delivers these capabilities — from real-time anomaly detection to unified performance and security observability — schedule a personalized platform demonstration with the Ennetix team.
FAQs
Static thresholds fail because they evaluate each metric in isolation against a fixed value — with no awareness of time of day, workload context, or infrastructure topology. Modern enterprise networks are hybrid environments spanning on-premises, multi-cloud, SD-WAN, and edge locations, each with dramatically different traffic patterns. A single upstream failure — a congested uplink or degraded routing path — cascades into hundreds of downstream alerts across application, network, and security teams simultaneously, burying the NOC in noise at the exact moment clarity is most needed. The structural shift required to address this is explored in Why Enterprise IT Teams Are Moving from Siloed Monitoring to Unified Observability.
Dynamic behavioral baselining replaces fixed metric limits with learned models of normal behavior — built per network element, per time of day, per day of week, and per operational context. A Monday morning spike in interface utilization consistent with weekly backup traffic is recognized as expected and suppressed. An identical spike at an unexpected time is flagged as anomalous. This context-awareness is what drives dramatic reductions in false positives. Unlike threshold tuning — which drifts out of alignment as environments change — behavioral baselines adapt continuously. The broader impact of this shift on alert fatigue in NOC and SOC teams is covered in Alert Fatigue in NOC and SOC Teams: How AI Correlation Ends the Noise in 2026.
Yes — and this is one of the most operationally significant capabilities of AI-driven network monitoring. Behavioral baselining catches anomalies that produce no performance impact but carry clear security signal: unusual east-west traffic patterns, unexpected connection frequencies to internal hosts, or device communication that deviates from its established baseline — all at traffic volumes that generate zero threshold violations. Traditional NPM tools would produce no alert. An AIOps platform surfaces these patterns and routes them to the security operations team. For how Ennetix structures threat detection alongside performance observability, see Threat Insights and Situational Awareness.
Five capabilities matter most: explainability (engineers must understand why an anomaly was flagged — black-box outputs erode trust), breadth of signal ingestion (NetFlow, SNMP, IPFIX, syslog, BGP events, device telemetry, and application flow), topology awareness (root cause and blast radius identification, not just symptom flagging), integration with existing ITSM and SOAR workflows, and deployment flexibility across on-premises, cloud, and hybrid environments. The xVisor Platform page outlines how Ennetix addresses each of these, and Automated Root Cause Analysis (RCA) for ITOps details how topology-aware correlation feeds directly into automated resolution workflows.