What Is Root Cause Analysis in IT Operations?
June 26, 2026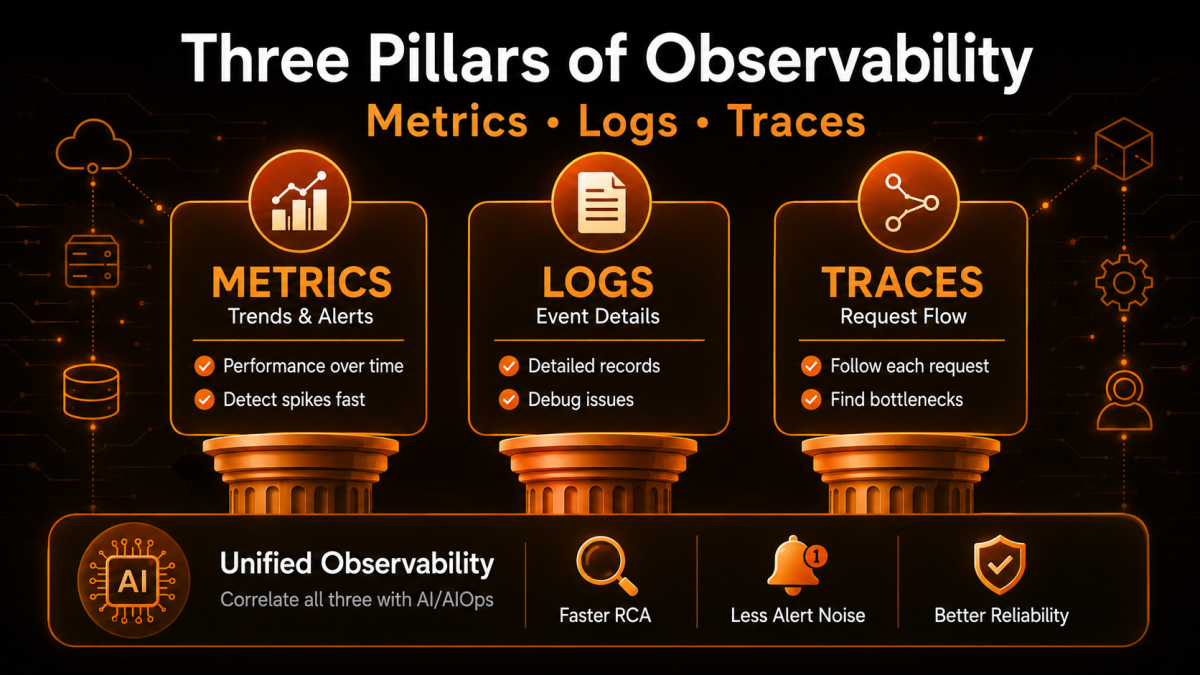
Three Pillars of Observability: Metrics, Logs, Traces
Every IT team eventually hits the same wall: an application slows down, a customer complains, and three different monitoring dashboards show three different stories. This is exactly why the three pillars of observability– metrics, logs, and traces- have become the foundation of modern IT operations. Together, these three pillars of observability give engineers a complete, evidence-based picture of how a system is behaving, instead of a patchwork of disconnected alerts. In this guide, we will break down what each pillar actually does, why the 3 pillars of observability are no longer optional for distributed, cloud-native environments, and how unified observability, powered by AIOps, turns raw telemetry into fast, confident decisions.
What Is Observability, and Why Does It Matter Now?
Observability is the ability to understand the internal state of a system purely from the data it produces, without having to guess or add new instrumentation every time something breaks. It grew out of a simple frustration: traditional monitoring tools were built to answer, “Is this server up or down?” but modern applications are built from dozens of microservices, containers, APIs, and third-party dependencies. A single user request might touch fifteen different services before a page finally loads. When something goes wrong, teams need more than a single green or red light; they need context.
That context comes from three pillars of observability working together. Each pillar answers a different question about system behaviour, and no single one of them is sufficient on its own. This is also where observability solutions differ sharply from legacy monitoring, since observability is designed for systems whose failure modes cannot always be predicted in advance.
What are the Three Pillars of Observability?
The three pillars of observability are metrics, logs, and traces. They are important because modern, distributed applications fail in complex, unpredictable ways that a single monitoring signal cannot fully explain. Using all 3 pillars of observability together gives engineering and operations teams the complete context needed to detect, diagnose, and resolve issues quickly.
Metrics: The Pulse of Your System
Metrics are numerical measurements collected at regular intervals, such as CPU utilisation, request latency, error rate, or memory consumption. Because metrics are lightweight and easy to aggregate, they are ideal for dashboards, trend analysis, and threshold-based alerting. A sudden spike in average response time or a climbing error-rate graph is often the first signal that something is wrong. However, metrics tell you that a problem exists; they rarely tell you why it is happening or which specific request or user was affected.
Logs: The Detailed Record of Events
Logs are timestamped, immutable records of discrete events, everything from an application exception to a failed database query or a security login attempt. Logs are the richest source of contextual detail available to engineers, but that richness comes at a cost: modern systems can generate millions of log lines per hour, and sifting through them manually is impractical. This is why log correlation, automatically linking related log entries across services, has become essential for turning raw log volume into usable insight.
Traces: Following a Request's Journey
Traces map the complete path of a single request as it travels across services, showing exactly how much time was spent at each hop. This is commonly called distributed tracing, and it is the pillar most responsible for solving the “it’s slow, but where” problem in microservices architectures. A trace can reveal that a checkout request spent 40 milliseconds in the payment service but 4 seconds waiting on a downstream inventory API, instantly narrowing the search for a fix.
Metrics vs Logs vs Traces: Key Differences
Understanding the difference between metrics, logs, and traces comes down to the type of question each one answers. Metrics answer “what” and “how much” over time, logs answer “what exactly happened” at a specific moment, and traces answer “where” a request spent its time across a distributed system. None of them replaces the others; they are complementary layers of the same picture.
- Metrics: aggregated, numerical, cheap to store, best for trends and alerting thresholds.
- Logs: granular, event-based, rich in detail, best for forensic investigation.
- Traces: request-scoped, sequential, best for pinpointing latency and service dependencies.
Why the Three Pillars Alone Aren't Enough
Simply collecting metrics, logs, and traces is not the same as achieving observability. In most organisations, each pillar lives in a separate tool, maintained by a separate team, with its own retention policy and its own query language. When an incident occurs, engineers are forced to manually jump between dashboards, trying to correlate a latency spike in one tool with an error log in another and a slow trace in a third. This manual correlation is slow, error-prone, and is one of the biggest contributors to alert fatigue, where engineers become desensitised to constant notifications and start ignoring alerts that actually matter.
The Power of Correlation: From Three Pillars to Unified Observability
The real value of the three pillars of observability is unlocked only when they are correlated automatically. Unified observability platforms ingest metrics, logs, and traces into a single data model, tagging them with shared identifiers such as trace IDs, service names, and timestamps. This allows a single click on a latency spike to surface the exact log lines and trace spans responsible for it, cutting investigation time from hours to minutes. Unified observability is not just a convenience; it is quickly becoming a baseline requirement for enterprises running hybrid cloud and multi-vendor network environments where digital experience assurance depends on catching problems before customers notice them.
How AIOps Strengthens the Three Pillars of Observability
AIOps applies machine learning and statistical analysis directly on top of metrics, logs, and traces, so teams are not left to manually stare at dashboards. Instead of static thresholds that trigger a flood of false alarms, AIOps platforms learn what “normal” looks like for every metric and flag genuine deviations.
Anomaly Detection Powered by Machine Learning
Rather than relying on fixed thresholds, machine-learning-driven anomaly detection continuously learns the seasonal and behavioural baseline of every service. This means a traffic pattern that would be perfectly normal on a Monday morning but unusual at 2 a.m. on a Sunday can be flagged automatically, without an engineer having to write and maintain thousands of manual rules.
Reducing Alert Fatigue Through Smart Correlation
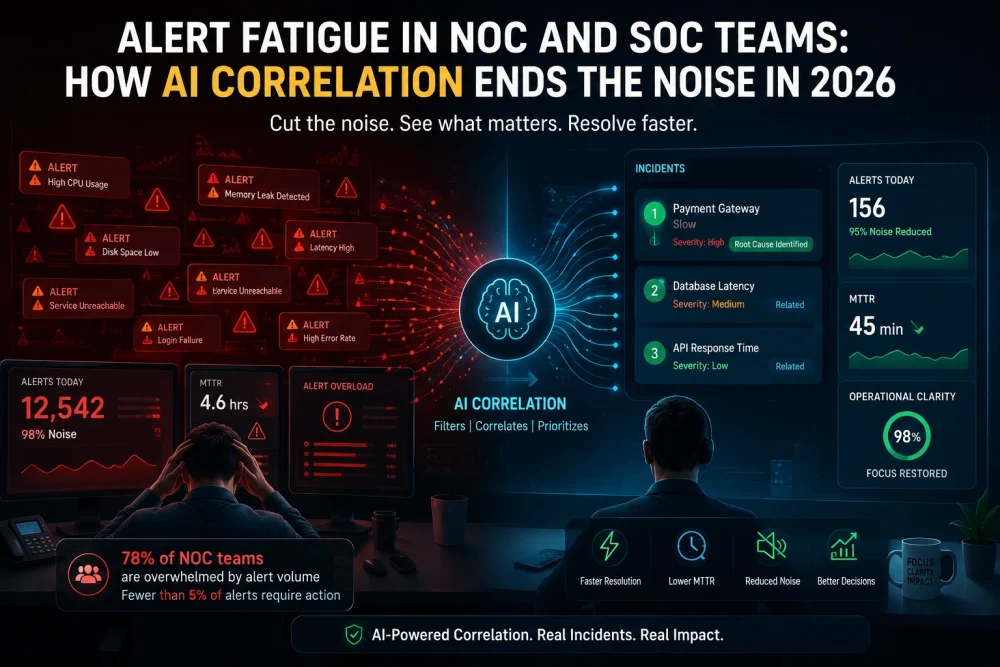
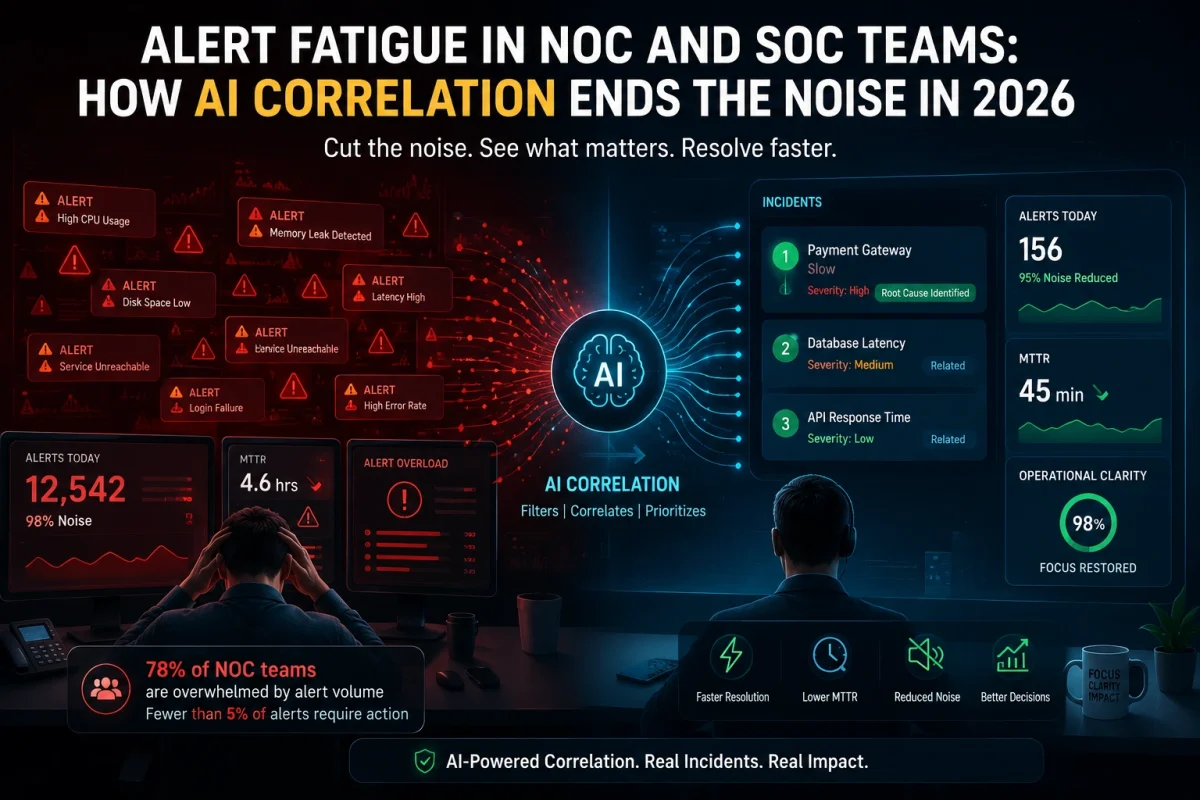
One of the clearest wins of AIOps-driven observability solutions is a dramatic reduction in alert fatigue. Instead of sending fifty separate alerts for fifty symptoms of the same underlying outage, correlation engines group related events into a single, prioritised incident, so on-call engineers see one actionable alert instead of a wall of noise.
Cutting MTTR with Automated Root-Cause Analysis
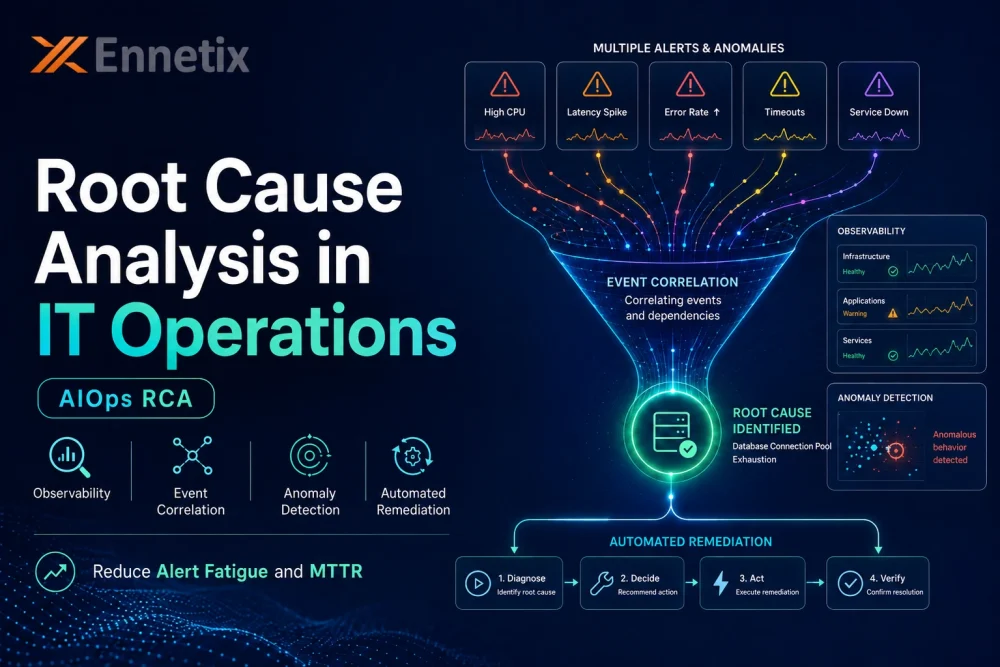
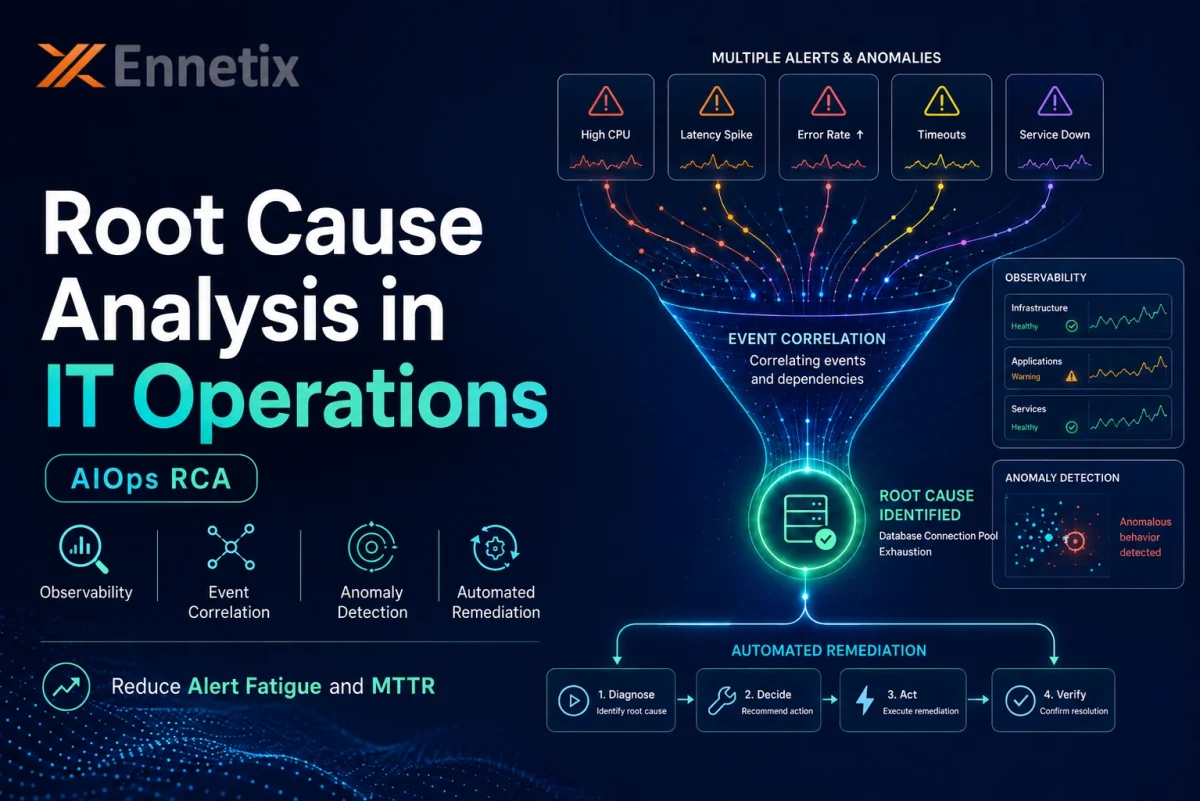
MTTR, or mean time to resolution, is one of the most closely watched metrics in IT operations, and it is directly tied to the speed of root-cause analysis. When metrics, logs, and traces are correlated automatically and paired with AI-driven root-cause analysis, teams can move from detecting an issue to isolating its origin in minutes rather than hours, which has a direct and measurable impact on customer experience and revenue.
Metrics, Logs, Traces, and Beyond: Understanding MELT
As observability has matured, many practitioners now talk about metrics, events, logs, and traces, commonly abbreviated as MELT, as the more complete data model behind modern observability solutions. Events capture discrete state changes, such as a deployment or a configuration change, that provide additional context around why a metric or trace suddenly looks different. Some vendors extend this further to describe metrics, logs, traces, and profiles, where continuous code-level profiling data is layered on top of the traditional three pillars of observability to pinpoint exactly which function or line of code is consuming the most resources. Whether an organisation frames it as three pillars or as MELT, the underlying goal is identical: full-context visibility with less manual digging.
Real-World Use Case: Observability in Action
Consider a retail application during a seasonal sale. Metrics show checkout latency climbing past acceptable limits. Instead of paging five different teams, a unified observability platform automatically correlates the latency metric with a trace showing the delay originates in a third-party payment gateway, and cross-references logs confirming repeated timeout errors from that specific vendor endpoint. What could have taken a war room of engineers two hours to diagnose manually is instead surfaced as a single, evidence-backed incident within minutes, allowing the team to fail over to a backup payment provider before most customers ever notice a slowdown.
Choosing the Right Observability Solutions for Your Organisation
Not all observability solutions are built the same way, and the right choice depends heavily on the complexity of your environment. When evaluating vendors, look beyond basic dashboards and consider the following factors.
- Native correlation across metrics, logs, and traces without manual stitching.
- Built-in AIOps capabilities for anomaly detection and automated root-cause analysis.
- Support for distributed tracing across hybrid, multi-cloud, and on-premises infrastructure.
- Noise reduction features specifically designed to combat alert fatigue.
- Digital experience assurance capabilities that connect backend telemetry to real end-user impact.
Best Practices for Implementing the Three Pillars of Observability
Rolling out observability successfully is as much a process change as a tooling change. A few practices consistently separate mature observability programs from ones that generate more noise than value.
- Standardise instrumentation early so every service emits metrics, logs, and traces in a consistent format.
- Tag telemetry with shared identifiers to make log correlation and trace lookups instant.
- Set meaningful, dynamic thresholds instead of static ones to minimise false positives.
- Continuously tune anomaly detection models as traffic patterns and architectures evolve.
- Track MTTR as a core KPI to measure whether observability investments are actually paying off.
How Ennetix Brings the Three Pillars Together with xVisor
Ennetix’s xVisor platform was built around the idea that IT and security telemetry should never live in silos. By unifying metrics, logs, and traces on a single AI-powered platform, xVisor helps NOC and SOC teams move from disjointed triage to predictive, correlated insight. Its AIOps engine applies anomaly detection and automated root-cause analysis across the full IT stack, which is a core reason customers report meaningfully lower alert fatigue and faster MTTR. For organisations that also care about digital experience assurance, unifying the three pillars of observability with security context on one platform means outages and threats are caught before they affect end users, not after.
FAQs
Metrics are numerical measurements collected over time, such as latency or CPU usage. Logs are detailed, timestamped records of individual events, like an error message or a login attempt. Traces follow a single request as it moves across multiple services, showing exactly where time was spent. Together, these three pillars of observability answer different questions: metrics show trends, logs show detail, and traces show flow.
Effective monitoring starts with consistent instrumentation across every service, followed by centralising data into a unified observability platform rather than separate point tools. From there, AIOps capabilities like anomaly detection can automatically flag unusual behaviour, while dashboards and automated root-cause analysis help teams analyse metrics, logs, and traces together instead of one at a time.
MELT typically stands for metrics, events, logs, and traces, an extended data model that adds discrete event data, like deployments or configuration changes, to the traditional three pillars of observability. This gives teams extra context for why a system's behaviour changed at a specific point in time, strengthening both anomaly detection and log correlation.
Metrics, events, logs, and traces expand on the classic three pillars of observability by explicitly calling out events, discrete occurrences like deploys, scaling actions, or configuration changes, as their own data type. Events act as helpful markers that make it easier to explain sudden shifts seen in metrics, logs, or traces.